Distributed Tracing for Batch Workloads with OpenTelemetry
Aug 2022 • 6 min read
With the rise of distributed systems in software applications, distributed tracing has become important in understanding how these systems work, and subsequently making them reliable.
If you’re unfamiliar, distributed tracing helps you visualise all the units of work performed in the lifecycle of a request across multiple systems. These include disk calls, DNS lookups, external requests, etc.
The visibility provided by tracing helps keep the biggest, most complex systems you use running. e.g. Google and Facebook. Hence, it’s unsurprising that Google built one of the first systems capable of distributed tracing - Dapper 1.
One caveat though, is that not all types of workloads fit into the standard model of tracing. An example is batch workloads, where the work done is asynchronous and doesn’t happen during the lifecycle of the original request.
In this article, we’ll discuss how to trace these types of workloads using a simple but powerful concept - context propagation.
The Nature of Distributed Tracing
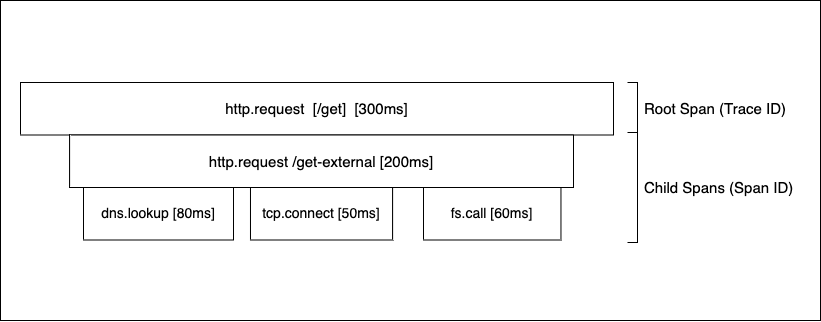
To understand how batch workloads don’t fit into the model of distributed tracing, let’s briefly discuss the model itself. Each request is represented by a trace, which contains spans that represent each unit of work. This creates a tree-like data structure 2, as shown in the diagram below.
To record traces for each request, applications import a tracing library 3 which collects and sends them to storage. This is called instrumentation. In practice, there are many different ways to instrument an application, depending on the language and tracing provider. There are open source solutions like opentelemetry, and commercial providers like Datadog, New Relic, and Honeycomb.
After storage, visualisation is the logical next step. A good visualisation should be simple, intuitive, and not look too different from the diagram above. It should also display any information obtained from what I like to call the secret sauce of tracing - context propagation.
By propagating context through the various units of work, it becomes easier to understand how a system behaves. A simple example is setting a unique identifier for the originator of a request, like the user’s email address. This is invaluable for customer service as it becomes easy to visualise the actual experience of the customer 4.
The Nature of Batch Workloads
When handling HTTP requests, it is preferable sometimes to defer the computation of a piece of work to a background process and send the response immediately. The workload could be:
- Compute-intensive
- Need to be handled by a separate service, or
- Have strong success requirements.
A simple example of this scenario is sending emails. This doesn’t need to be in-flight as it contributes nothing to the actual processing of the user request. It can be sent to a queue that has workers picking up and handling each one.
In distributed tracing, traces are collected for the life cycle of the request, which is why batch workloads that are handled on a separate process don’t fit the fundamental model. In the Dapper paper, Google describes the issue:
Dapper’s design was targeted at on-line serving systems, and the original objective was to understand system behaviour resulting from a user request to Google. However, off-line data intensive workloads, such as those that fit the MapReduce model, can also benefit from better performance insight.
As an example, let’s look at a basic NodeJS application that sends a dummy task to RabbitMQ on every request. The worker task itself only sends a request to google.com. Both the server and worker use OpenTelemetry to export traces to Jaeger for visualisation. Here’s what the core logic looks like:
// app.js
const opentelemetry = require("@opentelemetry/api");
const queue = require("./queue");

const tracer = opentelemetry.trace.getTracer(
    process.env.SERVICE_NAME || "request-service"
);

app.get("/", (req, res) => {
    const parentSpan = tracer.startSpan('send_to_queue', { attributes: { foo: 'bar' } });

    queue.send({foo: 'bar'});

    parentSpan.end();
    res.send("Hello World");
});

// tracing.js
const { registerInstrumentations } = require("@opentelemetry/instrumentation");
const { getNodeAutoInstrumentations } = require("@opentelemetry/auto-instrumentations-node");

registerInstrumentations({
    instrumentations: [getNodeAutoInstrumentations()],
});

// register the provider, service and processor here. Leaving out for brevity
registerOTLPServices();

// worker.js
// wrapped in an async function
const conn = await amqp.connect('amqp://localhost');
const channel = await conn.createChannel();

const queue = 'task_queue';

channel.consume(queue, async function(payload) {
  const data = JSON.parse(payload.content.toString());
  tracer.startActiveSpan(
      'process_queue_item',
      async (span) => {
        await makeExternalRequest("http://google.com");
        span.end();
  });
});
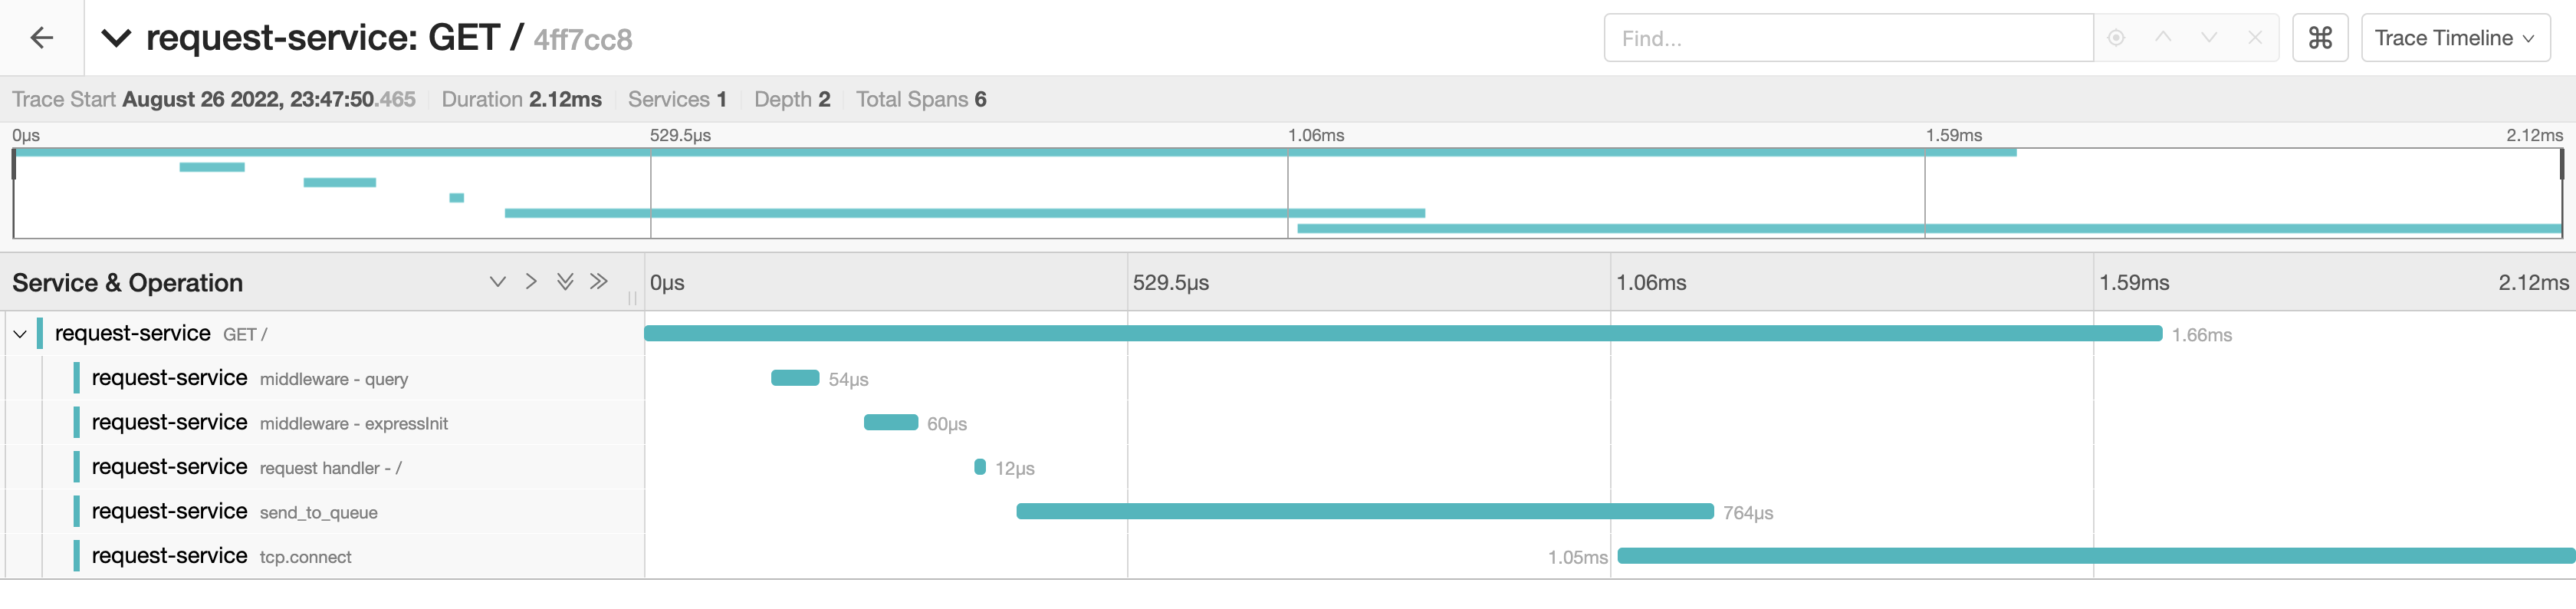
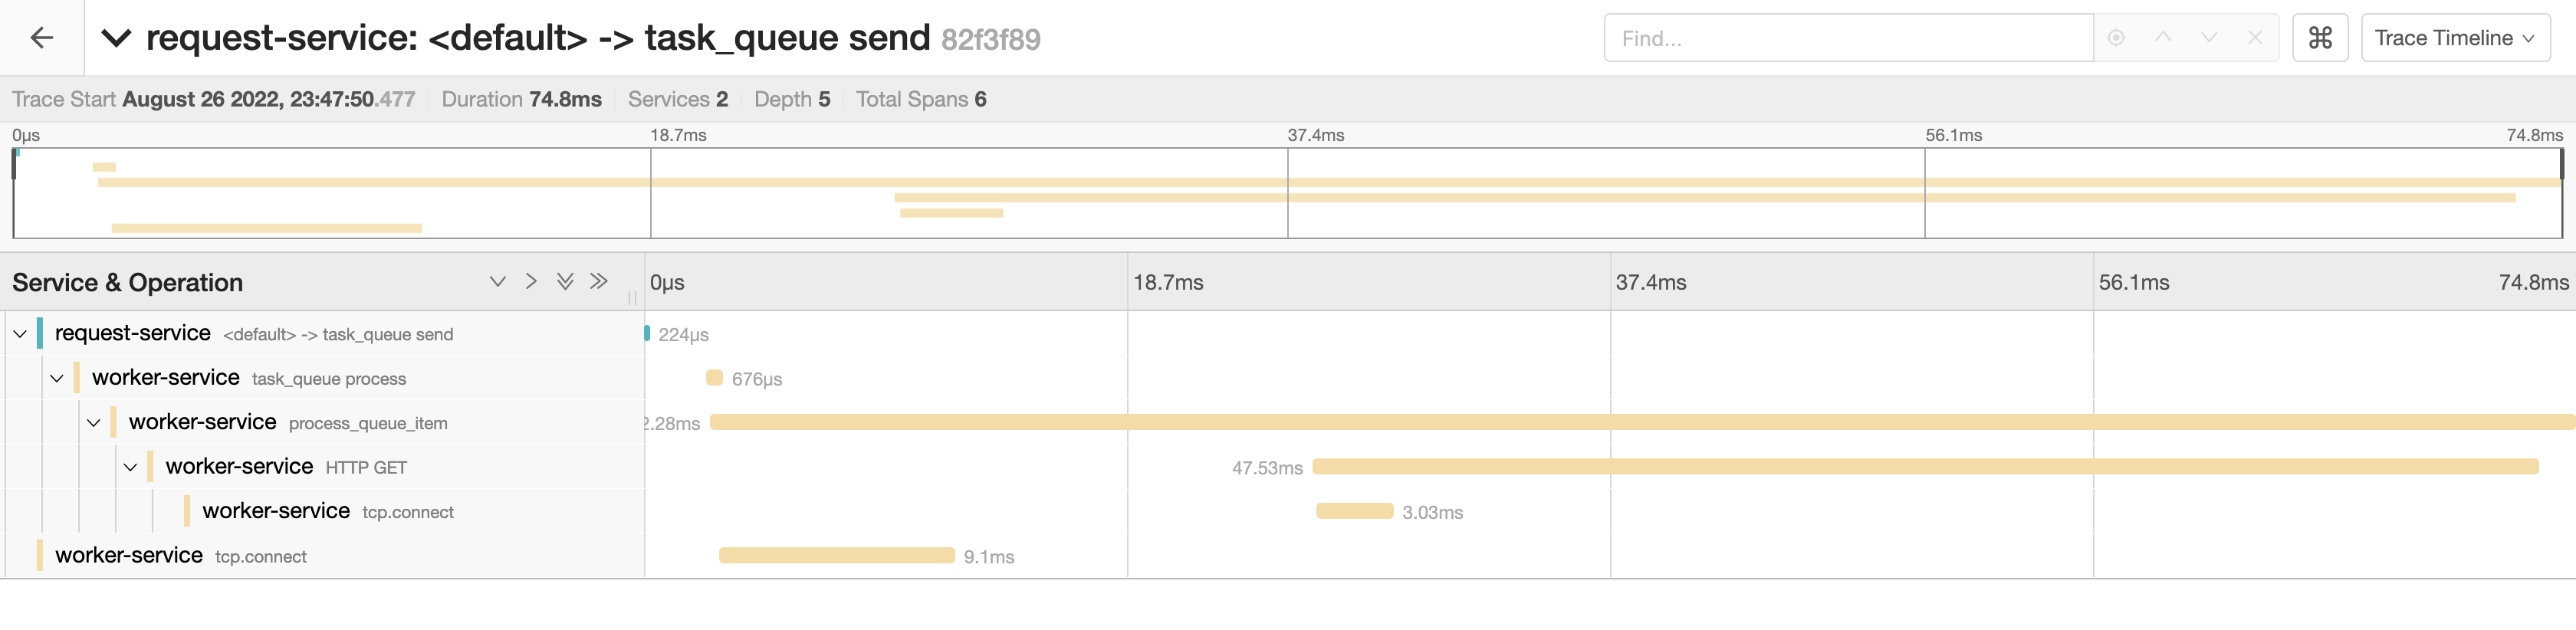
After handling some requests, the trace contains the declared spans and the worker handles the workloads fine. However, we can’t visualise what happens in the worker process because it is separated into a different trace, as seen in the images below:
The Nature of Tracing Batch Workloads
The good news is that this is not a particularly hard problem to solve, due to cross-process context propagation. By injecting trace context into the queue payload, we can help the background process recognize the parent trace and append child spans to the correct parents. This then provides a complete view.
The opentelemetry docs describe context propagation very well;
Distributed Tracing tracks the progression of a single Request, called a Trace, as it is handled by Services that make up an Application. A Distributed Trace transverses process, network and security boundaries. This requires context propagation, a mechanism where identifiers for a trace are sent to remote processes.
With this knowledge, we can propagate context using the OpenTelemetry Context Propagation API, which requires a “carrier” map to append the trace information, along with a “getter” object 5. Propagation can be achieved by doing the following:
- Modify the request handler to propagate the current span context into an empty map.
- Send the map context with the queue payload.
- In the worker, use the queued carrier context as the parent.
Let’s modify the example;
// app.js
const { W3CTraceContextPropagator } = require("@opentelemetry/core");

app.get("/", (req, res) => {
  const parentSpan = tracer.startSpan('send_to_queue');

  // inject the context into the carrier object and send
  // into the queue
  const propagator = new W3CTraceContextPropagator();
  let carrier = {};

  propagator.inject(
      opentelemetry.trace.setSpanContext(opentelemetry.ROOT_CONTEXT, parentSpan.spanContext()),
      carrier,
      opentelemetry.defaultTextMapSetter
  );

  queue.send({foo: 'bar', carrier });

  parentSpan.end();
});

// worker.js
channel.consume(queue, async function(payload) {
  // Extract the context from the queue payload and start
  // a child span. Ensures the new span is sent to the
  // original parent span.
  const data = JSON.parse(payload.content.toString());
  const parentContext = opentelemetry.propagation.extract(opentelemetry.ROOT_CONTEXT, data.carrier);
  opentelemetry.context.with(parentContext, async () => {
    tracer.startActiveSpan(
      'process_queue_item',
      async (span) => {
        await makeExternalRequest("http://google.com");
        span.end();
    });
  });
});
The carrier map contains a reference to the trace parent. Here’s an example of how it looks:
{ traceparent: '00-55319d0c4a44a2cc3ef02e43117528cb-b87e9a101a090735-01' }
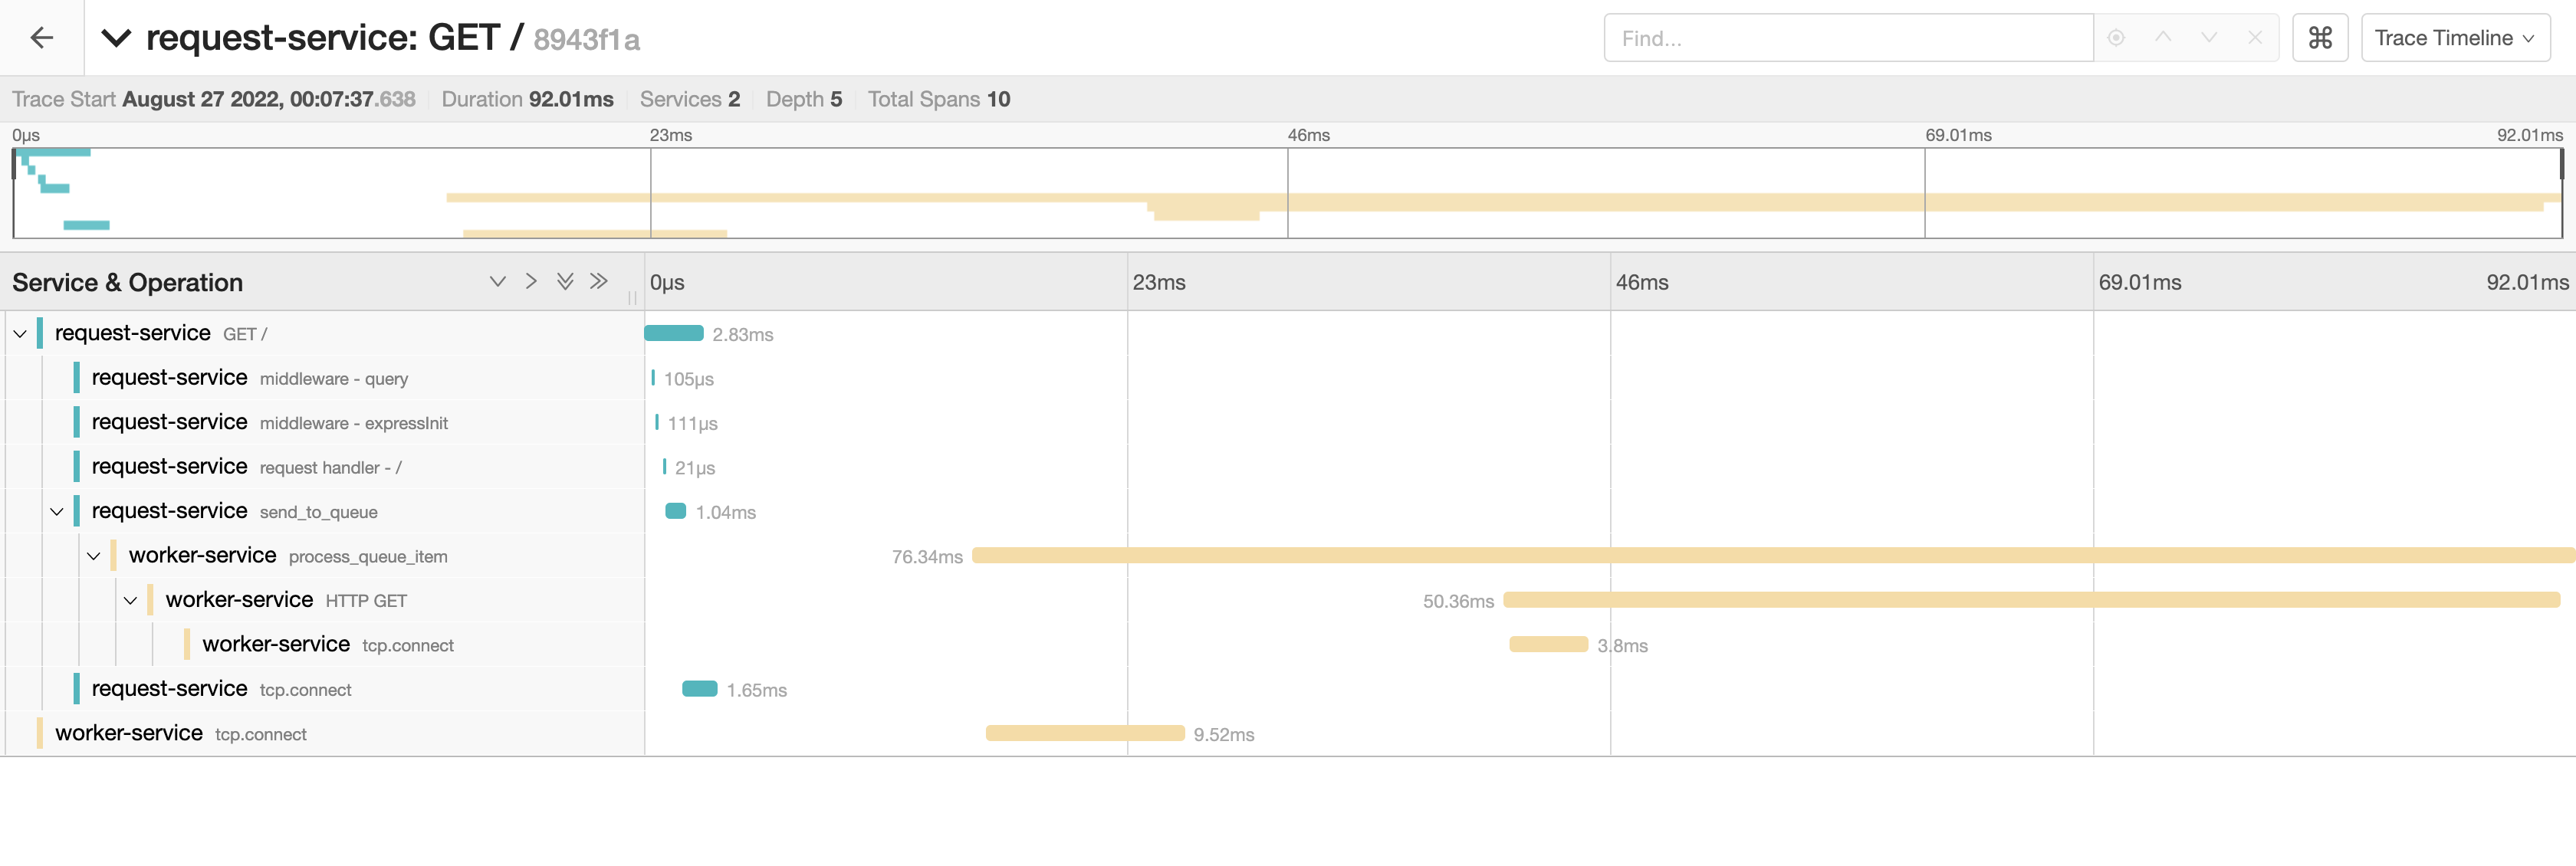
After propagating context and sending traces to the parent span, spans from the worker jobs are now visible in the context of the main request.
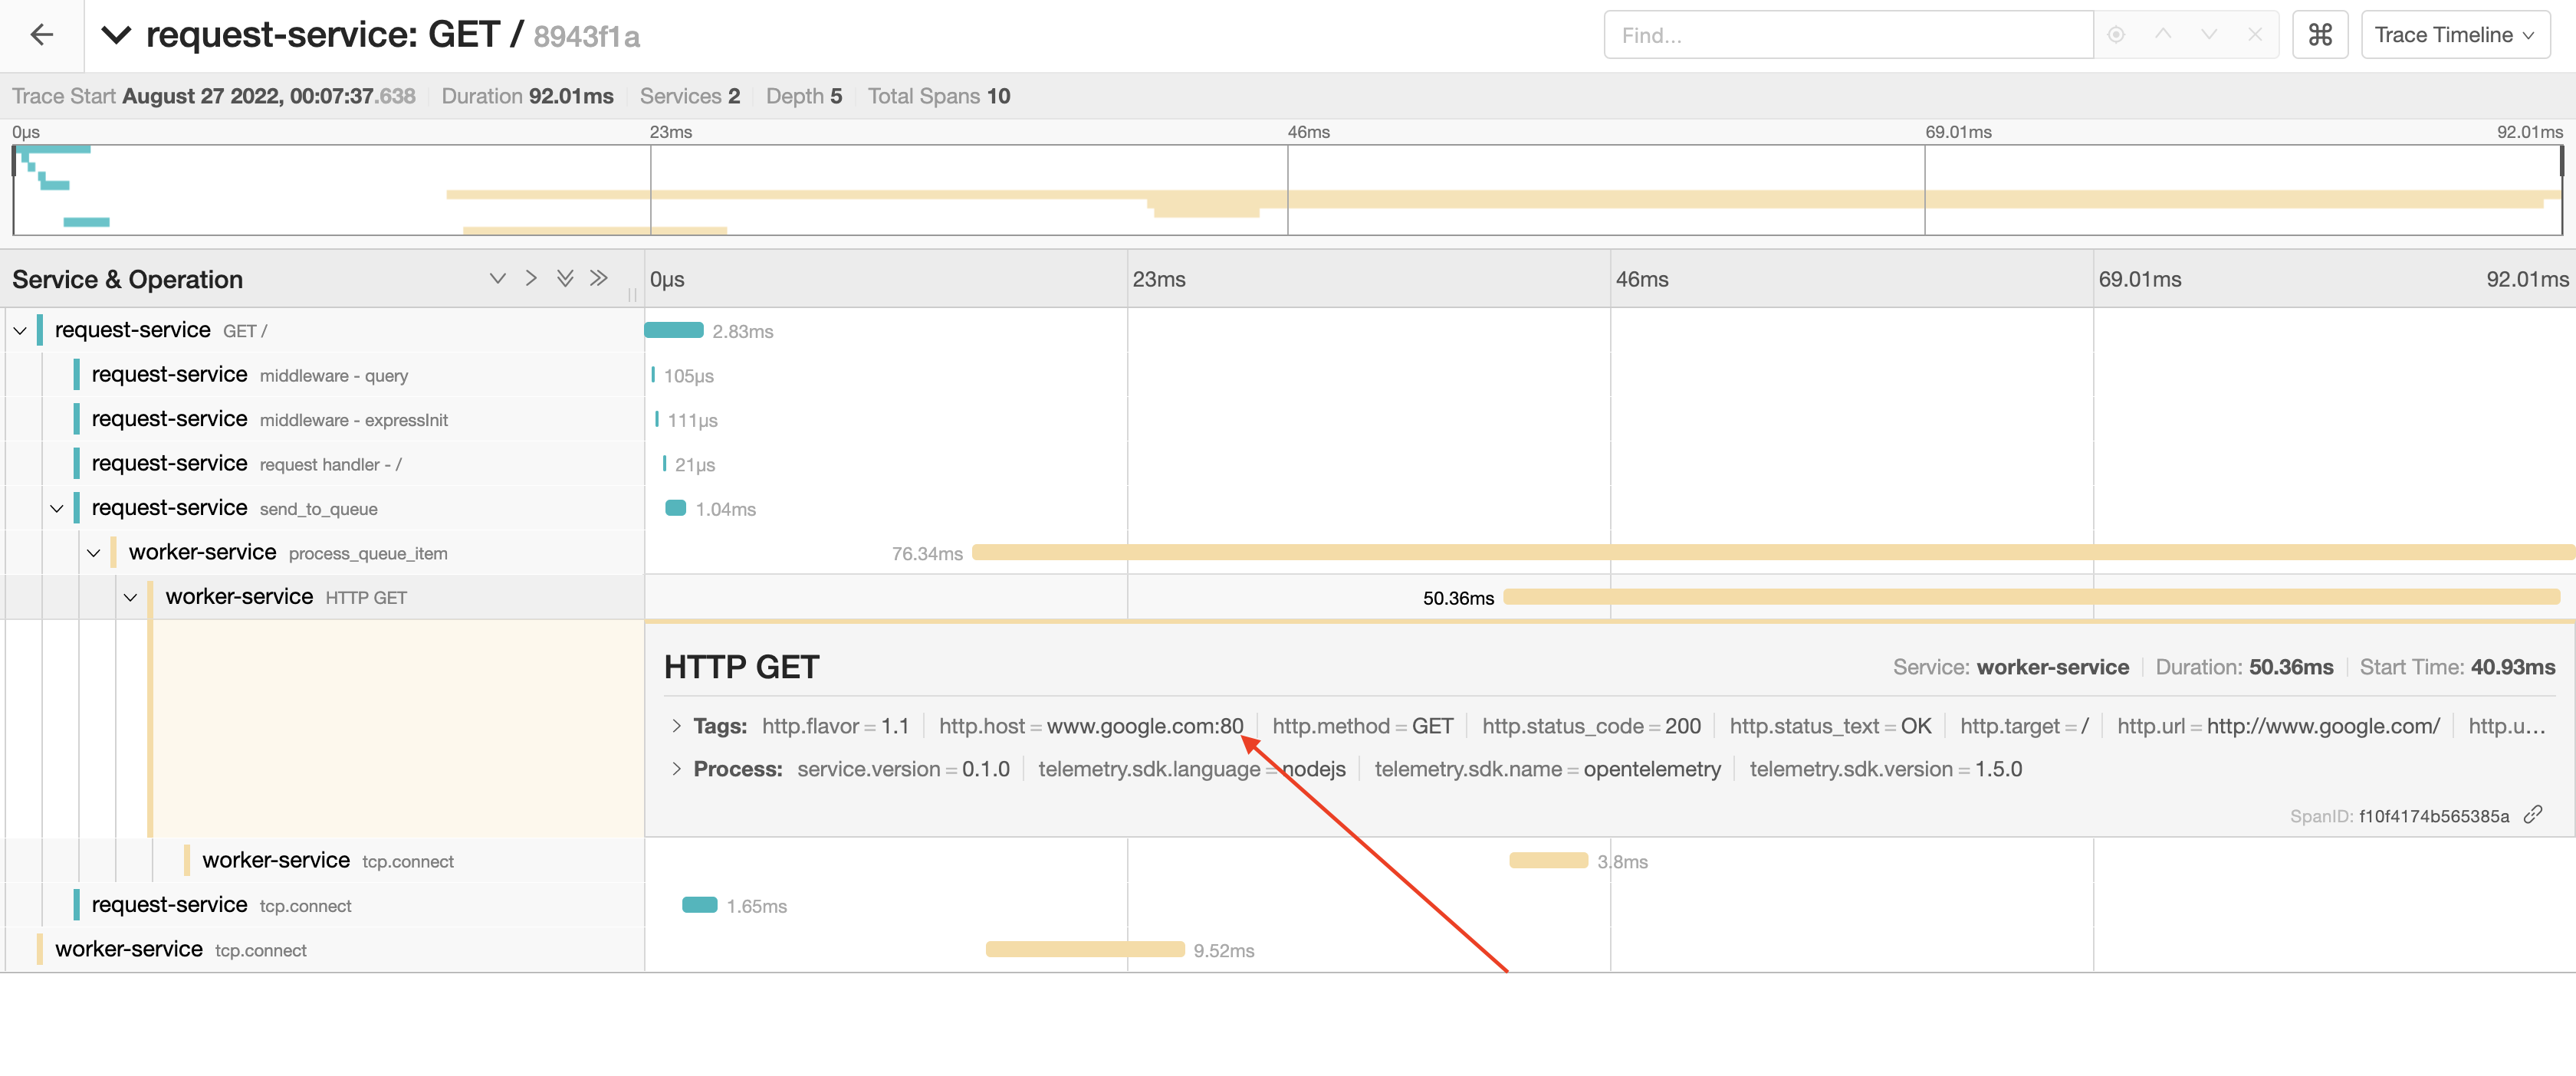
The OTLP Context Propagation API isn’t well-documented (probably because most don’t need to do any manual propagation), but if you dig hard enough most of what you need is there. If you’re ever stuck, you can look at the internals of existing OTLP libraries that do cross-process context propagation. e.g. @opentelemetry/instrumentation-amqplib.
Other Tracing Providers
-
In Datadog NodeJS, the trace API can also inject context into a carrier for cross-process propagation, using the text-map setter:
// app.js // inject context const opentracing = require("opentracing"); const tracer = require('dd-trace').init(); const span = tracer.scope().active(); const carrier = {}; tracer.inject(span, opentracing.FORMAT_TEXT_MAP, carrier); // worker.js // extract context and start child span const parent = tracer.extract(opentracing.FORMAT_TEXT_MAP, payload.carrier); const childSpan = tracer.startSpan("the.child", { childOf: parent }); // do the work childSpan.end(); -
The New Relic tracer does not seem to have the ability to start spans with parent contexts, so I’m not sure that context propagation can be handled arbitrarily. Spans are called “segments” and the
startSegmentmethod only receives the name, an option to record as a metric, a handler, and a callback. However, it’s possible to use OTLP and export to New Relic, which sounds like a decent workaround. -
Honeycomb has specific documentation for inter-process propagation. It’s pretty straightforward:
 // app.js
 const beeline = require("honeycomb-beeline")();

 const traceContext = beeline.honeycomb.marshalTraceContext(beeline.getTraceContext());

 payload.traceContext = traceContext;

 // worker.js
 const { traceId, parentSpanId, dataset, customContext } = beeline.honeycomb.unmarshalTraceContext(payload.traceContext);

 const trace = startTrace({ name }, traceId, parentSpanId, dataset, customContext);

 beeline.finishTrace(trace);
Summary
We’ve discussed distributed tracing in the context of batch workloads, and how we can get complete visibility by ensuring context is propagated properly. The main code samples use opentelemetry, but we also explored how to implement this on some other tracing providers.
It’s entirely possible that some providers can do this automatically, but it’s always good to know how to solve these kinds of problems when you encounter them in the wild.
Footnotes
-
In 2010, Google published the paper: Dapper, a Large-Scale Distributed Systems Tracing Infrastructure. Think of Dapper as the mother of all the modern tracing systems you know today. e.g. Zipkin (Twitter), Jaeger (Uber), OpenTelemetry etc. ↩
-
Some tracing systems (e.g. Zipkin, X-Trace) use trees, some use directed acylic graphs (e.g. Jaeger). It’s safe to think about them as trees in most cases. ↩
-
In tracing built for homogeneous systems (e.g. Dapper, Zipkin) which make RPCs for example, the instrumentation is not required as the tracers sit between the layers and record traces automatically. ↩
-
This is an incredible source of value for any company because along with analyzing single requests, you can create user-centric dashboards that present an overall view of the product experience. I experienced this first-hand when I was a part of building the Observability team at Paystack. ↩
-
The OTLP propagator requires a getter object which determines how the context is extracted, but this can differ from one provider to the next. e.g. the Datatdog Tracer API required declaration of a “format” as text. ↩
To help me grow on Youtube and learn about Monitoring, Machine Learning, and SRE, please subscribe here.
And to get notifiied about new posts, please subscribe here.