How good is your memory?
Dec 2021 • 13 min read
In this post we’ll explore various memory health concerns in NodeJS and ways to solve them. This is a semi follow-up to NodeJS in Flames - which discussed CPU profiling of NodeJS applications using flame-graphs.
It’s important to think about memory performance because in simple terms - bad performance can cause hard-to-squash bugs, downtimes, loss-in-revenue and other bad things that the grinch would love at Christmas. Imagine shipping a great product and then having multiple incidents caused by memory exhaustion in your application. In Node it’ll look like this;
FATAL ERROR: Ineffective mark-compacts near heap limit Allocation failed - JavaScript heap out of memory
 1: 0xa1a640 node::Abort() [node]
 2: 0xa1aa4c node::OnFatalError(char const*, char const*) [node]
 3: 0xb9a68e v8::Utils::ReportOOMFailure(v8::internal::Isolate*, char const*, bool) [node]
 4: 0xb9aa09 v8::internal::V8::FatalProcessOutOfMemory(v8::internal::Isolate*, char const*, bool) [node]
 5: 0xd57c85  [node]
 6: 0xd58316 v8::internal::Heap::RecomputeLimits(v8::internal::GarbageCollector) [node]
 7: 0xd64bd5 v8::internal::Heap::PerformGarbageCollection(v8::internal::GarbageCollector, v8::GCCallbackFlags) [node]
 8: 0xd65a85 v8::internal::Heap::CollectGarbage(v8::internal::AllocationSpace, v8::internal::GarbageCollectionReason, v8::GCCallbackFlags) [node]
 9: 0xd6853c v8::internal::Heap::AllocateRawWithRetryOrFail(int, v8::internal::AllocationType, v8::internal::AllocationOrigin, v8::internal::AllocationAlignment) [node]
10: 0xd2ef5b v8::internal::Factory::NewFillerObject(int, bool, v8::internal::AllocationType, v8::internal::AllocationOrigin) [node]
11: 0x107158e v8::internal::Runtime_AllocateInYoungGeneration(int, unsigned long*, v8::internal::Isolate*) [node]
12: 0x140de99  [node]
How do you begin to think about solving this? To answer this question in this article, we will:
- Begin with discussing memory management as a concept.
- Build up to how NodeJS does memory management.
- Finish with how you can solve some of the common memory management problems.
Memory Management Basics
Memory management is the process of controlling and coordinating the way a software application accesses computer memory. There are two things to think about here - how memory is allocated and how it is freed.
For allocation, software typically uses two regions of memory - stack and heap memory. The stack stores static data (e.g. string values and object addresses), while the heap stores dynamic data (e.g. objects) and is the largest portion as a result.
To free unused allocated heap memory, most modern programming languages perform Garbage Collection (GC). It’s one of the most common memory management techniques and runs at certain intervals.
How NodeJS allocates memory
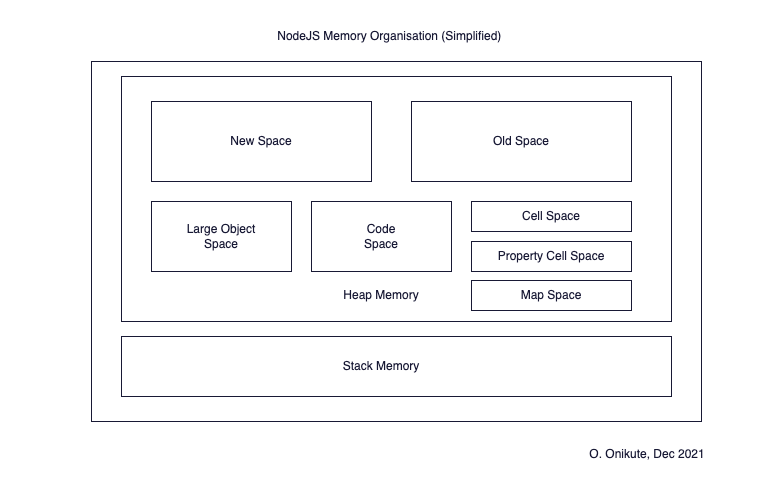
Node runs on the V8 engine so the way it handles memory is based on the V8 memory structure. Any program is represented by allocated memory in the V8 process called a Resident Set.
The heap memory has the largest area because it stores dynamic data. It is also where Garbage Collection takes place, which we’ll talk about in the next section.
Heap memory is divided into various segments (spaces). Each space consists of a set of pages, which are blocks of virtual memory which are mapped to physical memory in an OS. In V8, each page is 1MB in size. We will describe five (5) spaces below:
- New Space - New objects live here. They aren’t typically here for a long time and are cleared after a one or two GC cycles.
- Old Space - Older objects which survived being in the new space for two minor (scavenger) GC cycles live here.
- Large object space - Objects which are larger than the size limits of the other spaces live here. Each object gets it’s own page allocated. These large objects are never removed by the GC, which makes them a good candidate for optimising high memory usage in your application.
- Code Space - This is where the JIT Compiler stores compiled code.
- Cell Space, Property Cell Space, Map Space - This contains
Cells,PropertyCells, andMaps. They all contain objects which are the same size and have some constraints, which makes GC simpler.
How NodeJS frees up memory
The summary of how Node frees up memory should hopefully sound familiar at this point - GC cycles! Garbage Collection routinely cleans up unused memory by clearing out objects that aren’t needed anymore. The New Space is managed by the Scavenger (Minor GC) and the Old Space is managed by the Mark-Sweep & Mark-Compact (Major GC).
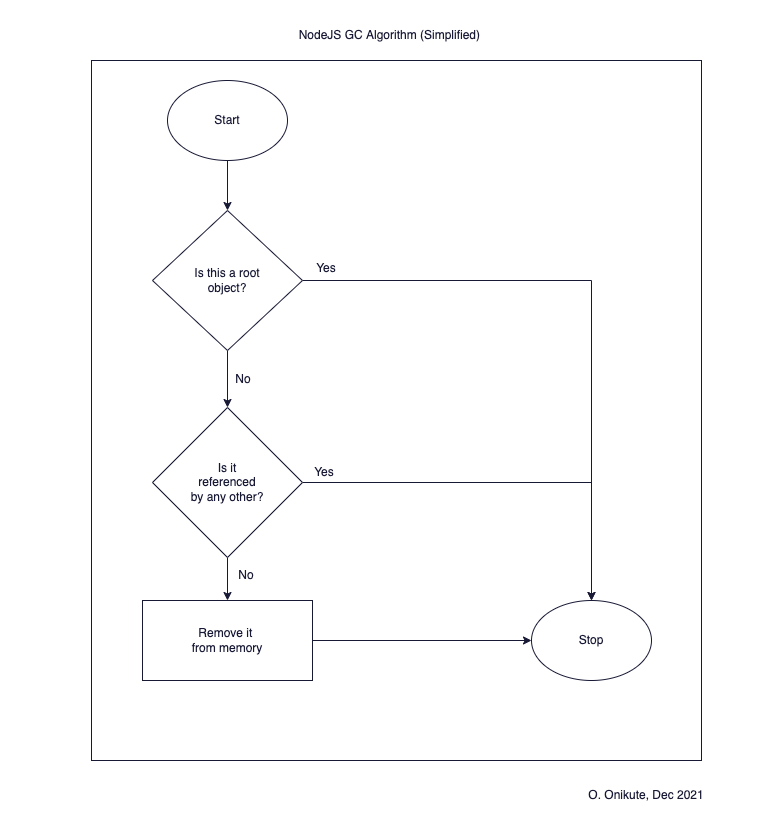
What we haven’t discussed yet is how the GC algorithms determine whether an object is used/unused. From this great tour of V8 garbage collection, an object is unused if:
- It is not a root object. A root object is one that’s pointed to directly by V8, or a global object.
- It is not referenced by any live or root object.
This means that the only way your program will free up memory is if it has a healthy cycle of unused objects. This is why using globals is discouraged, because they will never be removed by GC. They will take up memory space in your program forever and even worse if they continue to grow unbounded - your program will run out of heap memory and crash.
99 Problems but is Memory Management one of them?
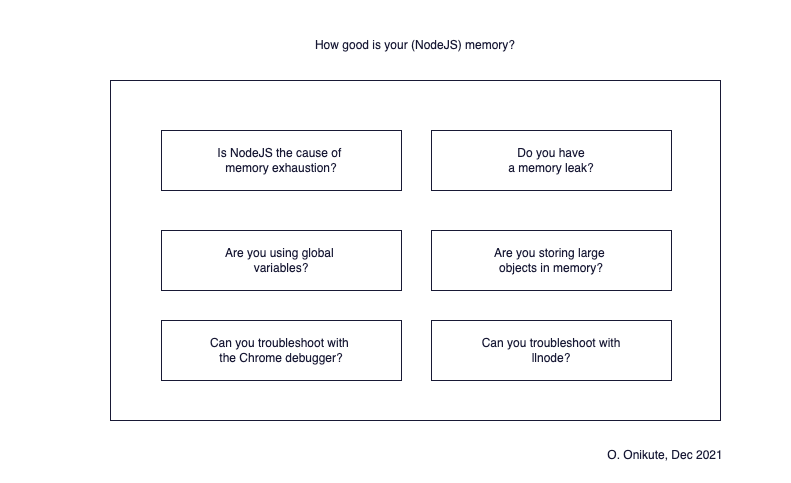
Now that we understand the basics of how Node allocates and frees memory, let’s run through a checklist of possible issues we can have with memory.
#1 - Is NodeJS the cause of memory exhaustion?
This is an article about memory usage in NodeJS applications, so it’s easy to assume that Node will always be the cause of the problem, but it won’t. The correct first step is to get information about what’s eating up memory.
A couple of ways you can do this are:
- One-time commands - These are shell commands you can run to get system information. One example on Linux is
top(orhtop) which you can use for CPU and memory analysis. Below is an example of the output fromtopin a Docker container running Node. From the (%MEM) column, we can see that Node is using 2.1% of memory.top - 18:31:26 up 7 min, 0 users, load average: 0.07, 0.20, 0.14 Tasks: 3 total, 1 running, 2 sleeping, 0 stopped, 0 zombie %Cpu(s): 0.0 us, 0.1 sy, 0.0 ni, 99.8 id, 0.0 wa, 0.0 hi, 0.0 si, 0.0 st KiB Mem : 2036540 total, 942600 free, 349168 used, 744772 buff/cache KiB Swap: 1048572 total, 1048572 free, 0 used. 1511216 avail Mem PID USER PR NI VIRT RES SHR S %CPU %MEM TIME+ COMMAND 1 root 20 0 585476 42076 28812 S 0.0 2.1 0:00.53 node 13 root 20 0 18184 3200 2776 S 0.0 0.2 0:00.01 bash 18 root 20 0 41020 3016 2560 R 0.0 0.1 0:00.00 topTo sort by process memory usage from highest to lowest, I pressed the
Shift + Mkey on my machine. The caveat though, is that while you can get information this way, you won’t be able to do historical analysis to spot any trends. You can only see what’s happening at the moment, which might not be enough when triaging an issue. - Long-term monitoring - For historical analysis and even alerting, there are a few options. You can install a monitoring agent which has the ability to record process’ usage information and even graph them for you. This way when you are troubleshooting an issue, you can see when the spike started, if it happens from time to time, if it’s short-lived etc. You can go with a commercial agent like Datadog or New Relic, check out an open-source agent 1, or run a Python tracker alongside your application and visualise when you’re ready.
#2 - Do you have a memory leak in Node? Is your app crashing?
A memory leak happens when your program allocates a memory continuously without freeing it. It becomes a problem if the process running your program then runs out of available memory and crashes, leading to a downtime 2.
Because the fine details of how memory is managed is abstracted away from you by Node, they can be tough to debug. However if you understand how the memory management works, you’re better equipped to understand how to solve them.
Let’s take a look at this example of a server endpoint with a leak;
const list = [];

app.use('/', function(req, res){
  list.push({
    "name": "hi",
    "arr":  new Array(100000)
  });
  res.status(200).send({message: "test"});
});
The reason for the memory leak here is that the size of the list array will grow with every request, and it won’t be garbage-collected because it’s a global variable. In the wild, it won’t always be this simple to figure out. e.g. your code may be fine, but a package you imported contains a nasty leak. Let’s talk about how to debug memory leaks below;
Using the chrome debugger
In most articles you will find on the internet, this will be the recommended method 3. It applies if you can reproduce the leak locally or can tunnel your production instance to your localhost (e.g. ssh -L 8080:localhost:8080 admin@example.com).
I’ll summarise this method described in the Heroku article below:
- Locally, you can run
node --inspect <file-name>.js. - Open the browser debugger.
- Under the
Profilestab, selectTake Heap Snapshot. This is the first snapshot without traffic, which should show the starting state of your app. - Send some traffic to the offending endpoint and take another snapshot. You can do this multiple times to get more snapshots.
- Select the latest snapshot and switch from the
Comparisonto theSummaryview. You can then view theObjectentry on the list to see what objects have been possibly leaked.
I like this method because it uses a familiar environment. But depending on your setup, you might not be able to port forward your production instance to localhost for security or other concerns, and might not be able to reproduce the leak locally. The next method - using llnode - is useful if you have access to the instance and can run shell commands on it.
Using llnode (Linux)
llnode is described as an lldb plugin for Node.js and V8, which enables inspection of JavaScript states for insights into Node.js processes and their core dumps. It is super useful for running postmortems when Node processes crash, but can also be used to analyse running programs.
It’s my current favourite method for memory analysis because of the port-forwarding issue with the Chrome debugger. The use-cases are:
- An app that’s running out of memory quickly - we can enable core dumps which will produce a core file when a crash happens. We can then inspect the memory state in the core file using llnode.
- An app that has a consistent memory growth before being replaced - we can take a core dump from the running process (this will slow down the Node process for a long or short time) and also use the core file with llnode for analysis.
The steps for using llnode are as follows:
- Enable core dumps 4.
ulimit -c unlimited - Set the coredump directory. i.e. where coredump files will be located.
echo '/tmp/coredump-%e-%p.gz' > /proc/sys/kernel/core_pattern - Install lldb dependencies.
apt-get update && apt-get install -y lldb-3.8 lldb-3.8-dev gcc g++ make gdb lldb - Install llnode
npm install -g llnode - Using the example above, i’ll send some traffic using Apache Benchmark to show how to detect what’s using up memory.
ab -c 100 -n 1000 -k http://localhost:3001/ - Generate the core dump. Either wait for the process to crash, send a kill signal or generate the dump from the running process. Depending on what you’re trying to figure out, you can generate multiple dumps like you’d do with the Chrome debugger. We can generate a dump from the running process using gcore:
  # install gdb if you haven't
  apt-get install gdb

  gcore `pgrep -n node`
Or do so by killing the process with a signal:
kill -BUS `pgrep -n node` - Run llnode on the generated dump. Note that you need a node executable that matches the one used to run your program.
llnode /usr/bin/node -c '<core-file-name>' - With an lldb shell open, you can get a backtrace of the code that led up to the point where the dump was created.
(lldb) v8 bt * thread #1: tid = 0, 0x00007f75719a7c19 libc.so.6`syscall + 25 at syscall.S:38, name = 'node', stop reason = signal SIGBUS * frame #0: 0x00007f75719a7c19 libc.so.6`syscall + 25 at syscall.S:38 frame #1: 0x0000000000fc375a node`uv__epoll_wait(epfd=, events=, nevents=, timeout=) + 26 at linux-syscalls.c:321 frame #2: 0x0000000000fc1838 node`uv__io_poll(loop=0x00000000019aa080, timeout=-1) + 424 at linux-core.c:243 frame #3: 0x0000000000fb2506 node`uv_run(loop=0x00000000019aa080, mode=UV_RUN_ONCE) + 342 at core.c:351 frame #4: 0x0000000000dfedf8 node`node::Start(int, char**) + 1080 frame #5: 0x00007f75718c7830 libc.so.6`__libc_start_main(main=(node`main), argc=2, argv=0x00007ffc531bb6b8, init=, fini=, rtld_fini=, stack_end=0x00007ffc531bb6a8) + 240 at libc-start.c:291 frame #6: 0x0000000000722f1d node`_start + 41 - You can also get the largest objects in memory using
v8 findjsobjects. Here’s the truncated output from our example, which shows that we have 4290 objects in memory with a size of 182,816KB (178.5MB). This is a good place to start our investigation. We can also see that we have 3k arrays with a total size of 102MB as well;(lldb) v8 findjsobjects Instances Total Size Name ---------- ---------- ---- ..... 14 448 ModuleWrap 15 480 IPv4 36 3168 (ArrayBufferView) 65 2080 CompiledFnEntry 77 6712 Module 101 3232 HTTPParser 144 3456 CallSite 225 19736 NativeModule 231 5544 NodeError 3284 105088 (Array) 4290 182816 Object 15371 55232 (String) - Now that we can tell what is using up memory, we can check occurrences of
Objectto see if any of them sticks out usingv8 findjsinstance. The-dflag can give us details of the objects on the fly. From the output, we can see a pattern of objects containing a string containing “hi” and an array with length 100000.(lldb) v8 findjsinstances -d Object 0x3ef59bcd17b9:<Object: Object properties { .name=0x26ab36156b31:<String: "hi">, .arr=0x3ef59bce8b39:<Array: length=100000>}> 0x10349a0fd79:<Object: Object properties { .name=0x26ab36156b31:<String: "hi">, .arr=0x10349a0f139:<Array: length=100000>}> 0x1233e93235a1:<Object: Object properties { .source=0x10349a19149:<String: "iana">, .compressible=0xe5809640639:<true>}> 0x292d7ed27361:<Object: Object properties { .constructor=0x292d7ed27281:<function: RuntimeError at >, .name=0xe58096443a9:<String: "RuntimeError">, .message=0xe5809640731:<String: "">, .toString=0x292d7ed05eb1:<function: toString at >}> 0x10349a13249:<Object: Object properties { .name=0x26ab36156b31:<String: "hi">, .arr=0x10349a33199:<Array: length=100000>}> ...The objects remaining in memory means something is referencing them. We can find out what’s referencing one with the
v8 findrefscommand;(llnode) v8 findrefs 0x367ec021a39 0x2c2cdf7e6391: (Array)[988]=0x367ec021a39From the output, an array at
0x2c2cdf7e6391is referencing this object and keeping it in memory. We can inspect the array (and any data type) using thev8 icommand;(llnode) v8 i 0x2c2cdf7e6391 0x2c2cdf7e6391:<Array: length=1289 { [0]=0x2e97f1096d69:<Object: Object>, [1]=0x2e97f1096d91:<Object: Object>, [2]=0x31142307ffc9:<Object: Object>, [3]=0x2e97f10989f1:<Object: Object>, [4]=0x22e5a640fe79:<Object: Object>, ...This means the array contains a bunch of objects. If we inspect the individual objects, we can confirm if they are the same.
  (llnode) v8 i 0x2e97f1096d69
  0x2e97f1096d69:<Object: Object properties {
      .name=0x26ab36156b31:<String: "hi">,
      .arr=0x2e97f1098749:<Array: length=100000>}>
We now know what’s keeping our objects in memory and causing the leak. We can inspect further, but at this point it’s time to use this information to check the code and fix the issue.
With llnode in your arsenal, you can figure out these sorts of issues on the affected server, or copy the core dump to your local machine and run the steps as well. As long as you have the corresponding node executable for your program, you can run the diagnostics anywhere.
An important disclaimer is that core dump files contain everything that was in memory at the time it was generated, which could include sensitive data like keys and user passwords. You should treat them with care and take measures to secure them properly. They can also be very large depending on the application memory usage, so be aware of any disk space constraints you may have and remember to turn them off when you’re done troubleshooting, especially if your servers aren’t ephemeral.
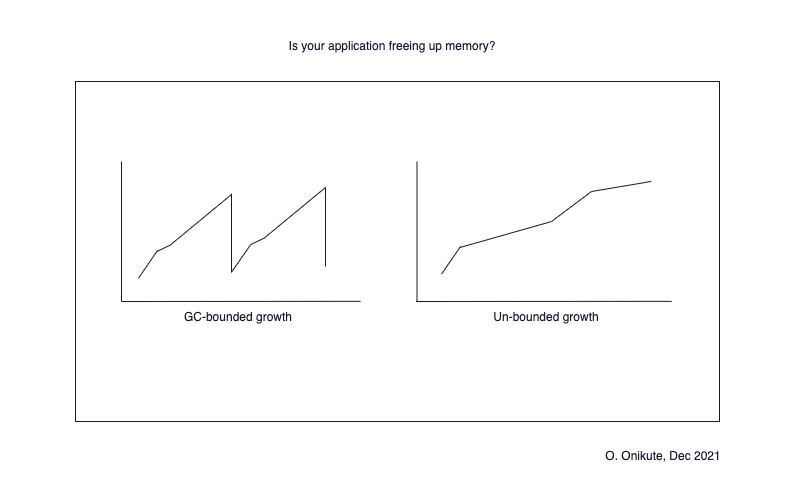
#3 - Is your application freeing up memory properly?
This isn’t really different from having a memory leak, except that it might be slower to surface and the crash would happen over a longer period of time. I just want to use this section to emphasize that your app doesn’t need to crash before you consider whether you’re using memory properly. Some sub-questions here are:
- How does memory grow in my application?
- How can I figure out what is causing that growth?
Consider this scenario - you need to move your app from one infrastructure to another. e.g. from Docker running on Kubernetes to a single process running on an AWS EC2 instance (please don’t do that). When running on Kubernetes, if your app’s memory grows steadily until it hits the limit, the pod will get replaced. But on a standalone server running one or two processes, you might not have that luxury out of the box.
For example, you would have to manage the process with supervisord to make sure it restarts when it crashes. You might not think of that right away, so you’re guaranteed at least one downtime (and continuous downtimes depending on how long it takes to restart the process on a crash).
To confirm if you’re freeing up memory, you can do the following:
- Take a look at the memory usage graph of your Node process. It should be in a seesaw pattern as it grows and GC cleans up.
- If it is growing unbounded - send some traffic, take a core dump or heap snapshot and then use the corresponding tool to see what is staying in memory after GC cycles, and what is keeping it there.
#4 - Are you storing large objects in memory?
If you have large objects in memory, you run several risks including memory crashes, slower processing etc. It’s even worse if those objects aren’t being garbage-collected - you’ll get a memory crash faster than you can say Jack Sparrow.
I can think of two examples of when objects can get heavy and should be noted;
- The
reqobject in express-like frameworks - We add information such as user details to thereqobject using middlewares. Depending on the size of the data we add, it can get pretty large. When you consider that it also contains headers from your clients, the list gets even longer. As long as you aren’t keeping these objects in memory, you shouldn’t have anything to worry about unless they are getting ridiculously large. But one thing to keep in mind is when passing them around, their large size can lead to unforeseen problems. e.g if an error stack with a lot of lines is attached and you try to log using Winston, you might run into this sort of problem. In our example above, let’s add a step to log the tasks array using Winston;... const winston = require('winston'); ... const logger = winston.createLogger({ level: 'info', format: winston.format.json(), defaultMeta: { service: 'test-service' }, transports: [ new winston.transports.Console({}) ], }); ... app.use('/', function(req, res){ list.push({ "name": "hi", "arr": new Array(100000) }); logger.log("info", list); res.status(200).send({message: "test"}); });In previous examples, the Node server could handle 1000 requests normally. After adding Winston logging, it ran out of memory after 813 requests:
  // Apache Benchmark output
  $ ab -c 100 -n 1000 -k http://localhost:3001/
  This is ApacheBench, Version 2.3 <$Revision: 1879490 $>
  Copyright 1996 Adam Twiss, Zeus Technology Ltd, http://www.zeustech.net/
  Licensed to The Apache Software Foundation, http://www.apache.org/

  Benchmarking localhost (be patient)
  Completed 100 requests
  Completed 200 requests
  Completed 300 requests
  Completed 400 requests
  Completed 500 requests
  Completed 600 requests
  Completed 700 requests
  Completed 800 requests

  Test aborted after 10 failures

  apr_socket_connect(): Connection reset by peer (54)
  Total of 813 requests completed
// Node OOM logs app_1 | <--- Last few GCs ---> app_1 | app_1 | [1:0x37fbda0] 35308 ms: Mark-sweep 994.1 (1006.6) -> 994.0 (999.9) MB, 732.6 / 0.0 ms (+ 180.0 ms in 43 steps since start of marking, biggest step 6.3 ms, walltime since start of marking 916 ms) (average mu = 0.072, current mu = 0.017) finalize increm app_1 | app_1 | <--- JS stacktrace ---> app_1 | app_1 | ==== JS stack trace ========================================= app_1 | app_1 | 0: ExitFrame [pc: 0x140de99] app_1 | 1: StubFrame [pc: 0x140ed6d] app_1 | Security context: 0x3517395008d1 <JSObject> app_1 | 2: stringifyReplacerFn(aka stringifyReplacerFn) [0x1969fa67e7b9] [/usr/src/app/node_modules/safe-stable-stringify/stable.js:~386] [pc=0x34bb07f0dba4](this=0x0b37cfa404b1 <undefined>,0x0c3a40973109 <String[#3]: arr>,0x123cd27cab41 <Object map = 0x3d70073f7759>,0x1bbae0350939 <JSArray[3]>,0x1969fa67cec1 <JSFunction replacer (sfi... app_1 | app_1 | FATAL ERROR: Ineffective mark-compacts near heap limit Allocation failed - JavaScript heap out of memory app_1 | 1: 0xa1a640 node::Abort() [node] app_1 | 2: 0xa1aa4c node::OnFatalError(char const*, char const*) [node] app_1 | 3: 0xb9a68e v8::Utils::ReportOOMFailure(v8::internal::Isolate*, char const*, bool) [node] app_1 | 4: 0xb9aa09 v8::internal::V8::FatalProcessOutOfMemory(v8::internal::Isolate*, char const*, bool) [node] app_1 | 5: 0xd57c85 [node] app_1 | 6: 0xd58316 v8::internal::Heap::RecomputeLimits(v8::internal::GarbageCollector) [node] app_1 | 7: 0xd64bd5 v8::internal::Heap::PerformGarbageCollection(v8::internal::GarbageCollector, v8::GCCallbackFlags) [node] app_1 | 8: 0xd65a85 v8::internal::Heap::CollectGarbage(v8::internal::AllocationSpace, v8::internal::GarbageCollectionReason, v8::GCCallbackFlags) [node] app_1 | 9: 0xd6853c v8::internal::Heap::AllocateRawWithRetryOrFail(int, v8::internal::AllocationType, v8::internal::AllocationOrigin, v8::internal::AllocationAlignment) [node] app_1 | 10: 0xd2ef5b v8::internal::Factory::NewFillerObject(int, bool, v8::internal::AllocationType, v8::internal::AllocationOrigin) [node] app_1 | 11: 0x107158e v8::internal::Runtime_AllocateInYoungGeneration(int, unsigned long*, v8::internal::Isolate*) [node] app_1 | 12: 0x140de99 [node]This is something to be careful about, especially if your application is log-heavy.
- Processing large data - When doing large processing from files for example, it might be tempting to load large chunks of them into memory in batches. It would be best to stream instead, for reasons we’ve covered before now.
#5 - Are you using global variables?
The gist with global variables is that they won’t be Garbage-Collected (removed from memory). While it’s not recommended, you can get by with global variables as long as you are not storing large amounts of data in them and not cleaning them up yourself.
For example if you are using a global variable to do some in-memory caching, you need to remember to reset the value where it’s applicable to your application. If you don’t do this, you’re bound to run out of memory eventually.
In our example, the list array is a global variable. This is the reason the list continues to grow with every request until the crash happens. Since our aim was to collect a record of each request for some reason, we can modify the implementation to write to a storage layer instead. For simplicity, we can stream to a file:
app.use('/', function(req, res){
  // this will overwrite the file on every request, but
  // I want to keep it in this code block for brevity of
  // the example.
  const writableStream = fs.createWriteStream("out.txt");
  writableStream.write(JSON.stringify({
    "name": "hi",
    "arr":  new Array(100000)
  }));
  writableStream.on('error',  (error) => {
      console.log(`An error occured while writing to the file. Error: ${error.message}`);
  });
  res.status(200).send({message: "test"});
});
And now the server can handle even double the amount of requests without running out of memory:
$ ab -c 100 -n 2000 -k http://localhost:3001/
This is ApacheBench, Version 2.3 <$Revision: 1879490 $>
Copyright 1996 Adam Twiss, Zeus Technology Ltd, http://www.zeustech.net/
Licensed to The Apache Software Foundation, http://www.apache.org/

Benchmarking localhost (be patient)
Completed 200 requests
Completed 400 requests
Completed 600 requests
Completed 800 requests
Completed 1000 requests
Completed 1200 requests
Completed 1400 requests
Completed 1600 requests
Completed 1800 requests
Completed 2000 requests
Finished 2000 requests
Conclusion
When thinking about memory performance in your app, consider the following questions:
- Is NodeJs the source of memory growth/exhaustion?
- Do you have a memory leak?
- Are you storing large objects in memory?
- Are you using global variables?
In this post, we’ve discussed memory usage in Node and a bunch of different stumbling blocks. There are a lot of articles about figuring out memory leaks using the Chrome debugger, so I didn’t spend too much time talking about that.
Troubleshooting with llnode is less popular however, and might be the perfect solution for some production scenarios. Hopefully you find that interesting and explore more. The code samples can be found in this repository. Let me know if you have any comments or concerns!
Thanks to Chidi, Ari and Ife for looking through drafts of this ❤️
Further Reading
- Garbage collection Wiki
- A tour of V8: Garbage Collection
- Visualizing memory management in V8 Engine
- Memory Management in JS - Mozilla
- Node.js memory management in container environments
- Avoiding Memory Leaks in Node.js: Best Practices for Performance
- 4 Types of Memory Leaks in JavaScript and How to Get Rid Of Them
- Understanding memory leaks in Node.js apps
- Debugging Memory Leaks in Node.js Applications - Toptal
- Nodejs Kubernetes – an OOM serial killer story
- Optimizing V8 memory consumption
- Node Memory Flamegraphs
- Node.js Postmortem Debugging for Fun and Production
Footnotes
-
Prometheus doesn’t have an easy way to export process metrics, but if you can write an exporter for CPU and memory stats for Node, you can then visualise with Grafana and set up alerts with Prometheus. Sounds like a fun project ngl. ↩
-
Some examples of great resources on this are The Heroku article and Auth0 describing finding leaks in browser Javascript code. ↩
-
This will remove the limit on the size of files that can be created on the server, allowing core dumps to be created. Reason for this is that they can get very large so they are disabled by default. ↩
To help me grow on Youtube and learn about Monitoring, Machine Learning, and SRE, please subscribe here.
And to get notifiied about new posts, please subscribe here.