Grafana and LLMs
July 2025 • 12 min read
Technological shifts have always defined the way we interpret data. In the 1990s, getting a sales report or chart meant waiting for data specialists to pull data from databases. The 2000s changed that with self-service tools like Tableau, that introduced user-friendly interfaces to visualise the data with no SQL or coding required 1.
A similar shift is happening with LLMs, which allow users to ask questions to get insights. I have been thinking about what this means for monitoring – Instead of dragging charts around, what if users could describe the insights they need using natural language? This dream of simply asking computers for answers is not new. In the 1970s, IBM Researchers created Query-by-Example - a way to get information by filling a form instead of writing SQL 2. 50 years later, the technology has caught up to the vision.
My next online course focuses on Grafana - a widely-used tool for visualising metrics using dashboards. In one of the chapters, I explain how LLMs and natural-language queries can shift how we interact with dashboards and more importantly, how to get it done.
But why is the use of LLMs in dashboards relevant?
Problems with Grafana
While preparing for the course, I asked other SREs what they currently hate about using Grafana. A lot of the comments were about difficulty doing basic things with panels. A few years ago, I did not enjoy working with Grafana - especially when I needed to create table panels. What I’d expect to be a 30-minute task would end up taking more than double the time, leaving me frustrated.
I don’t expect any of these problems to go away – at least directly. A monitoring tool like Grafana has to support both simple and complex use-cases, and the nature of the tooling reflects that. Unfortunately, the complex tools can easily get in the way of the simple.
An approach I’ve seen Grafana (and Prometheus) take to make the tooling easier to understand is to add helpers. Grafana includes help descriptors for Transformations, and tools like Promlens provide assistance for writing and understanding PromQL.
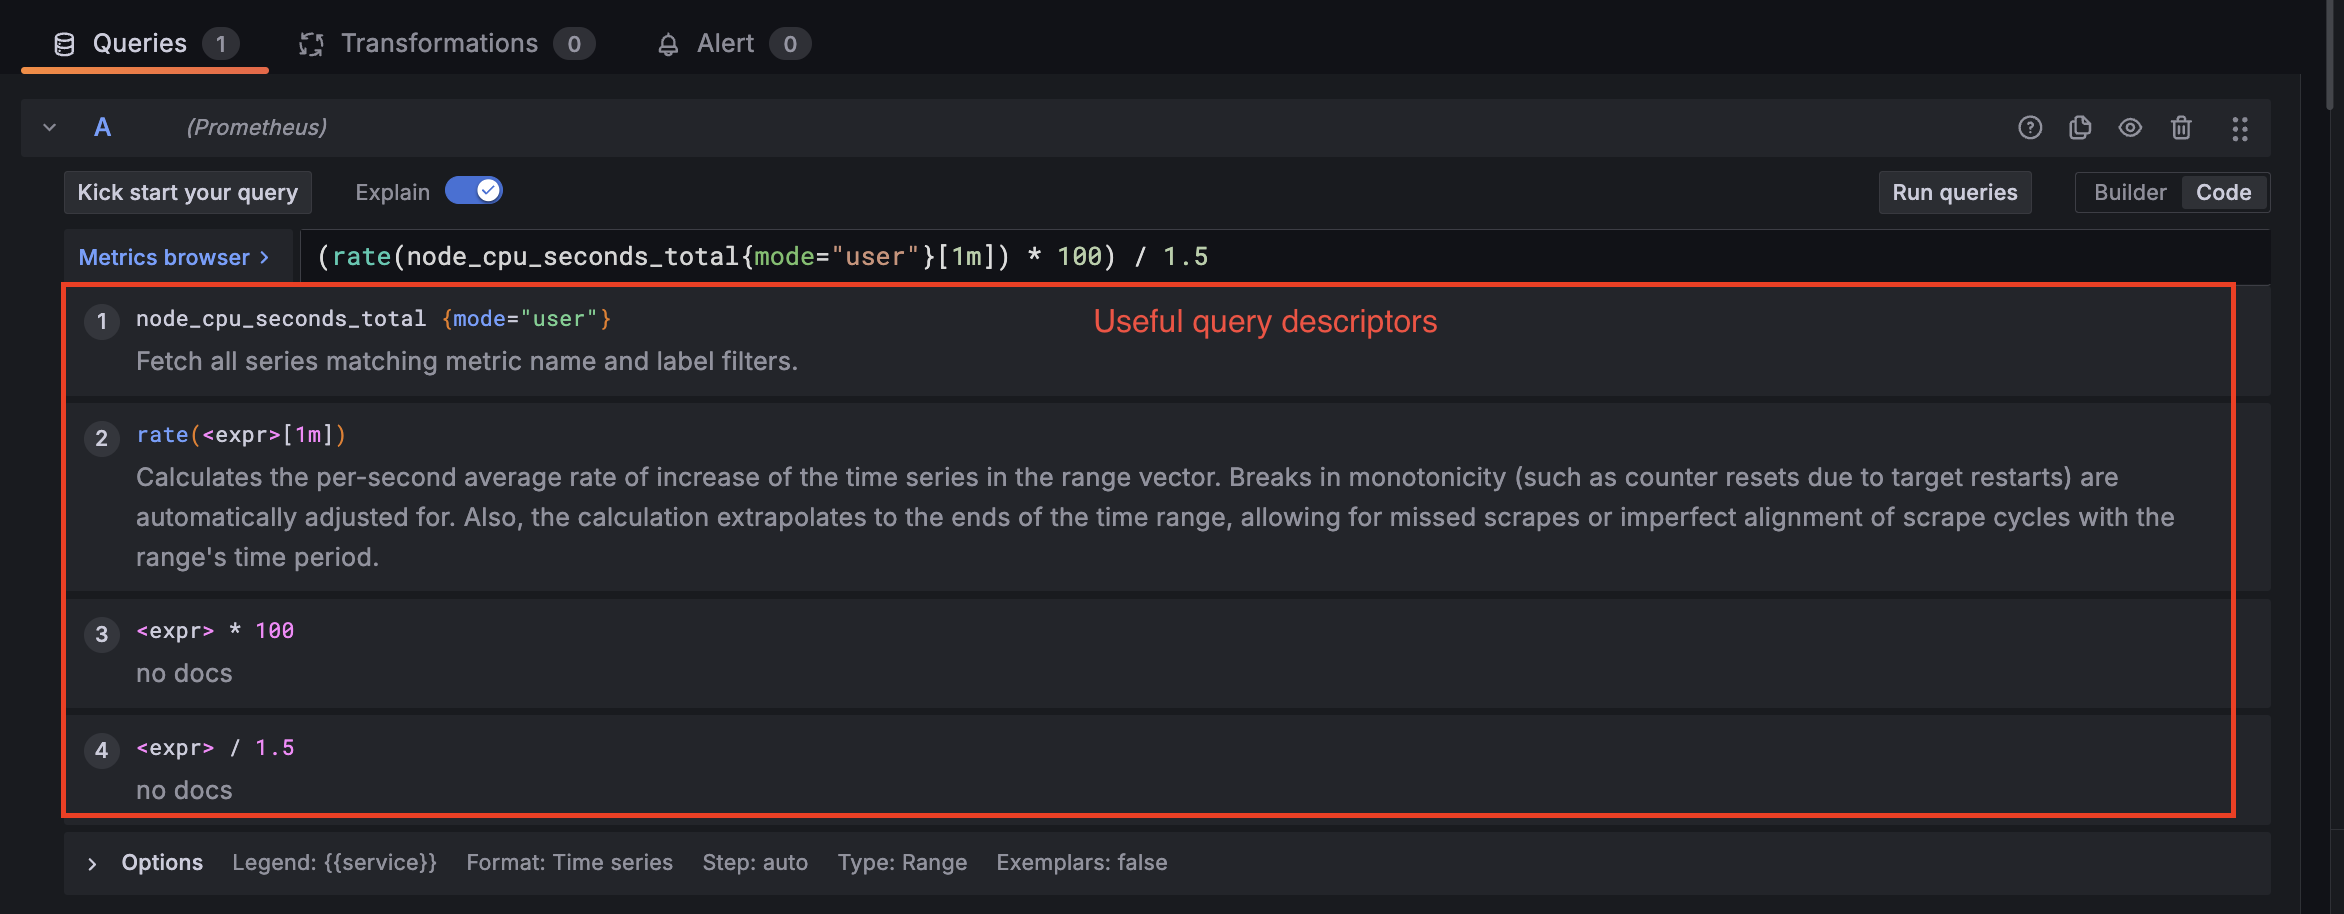
Naturally, this type of assistance is the future of making Grafana simple to use. Can natural language be the solution to common Grafana usability woes?
Grafana and LLMs
With the right context provided, an LLM assistant for your dashboard can both be a search engine and assistant. You could ask the LLM to help you troubleshoot a tricky Transformation that’s not working, show you new insights in specific ways, and previously impossible tasks like spotting anomalies become easier.
Earlier this year, I spent a lot of time researching what was currently available, and I wasn’t too impressed with what Grafana had available. There was no integration for LLM assistance in dashboards. That changed two months ago at the latest GrafanaCon, where they announced plans for a native LLM agent built into Grafana Cloud.
Before the announcement, I had come up with an open-source way to get LLMs into Grafana dashboards natively. Inspired by this Youtube video from Grafana Labs, this solution uses a panel plugin that can receive text queries and send them to an LLM. The main change I made is in the architecture - a backend API is more secure and should be the bridge between the plugin and the LLM.
I go into more detail and walk through the code a bit in this video. The rest of this post will discuss everything that’s relevant about how LLMs can interact with Grafana.
The Grafana JSON Model
Every dashboard is represented by a JSON object. This is really useful for interacting with dashboards in code - forming the basis for advances like dashboards-as-code. I’ve particularly found it useful when working with larger teams to declare dashboards using Terraform.
Here’s what the model looks like. Each dashboard has a unique identifier and other useful metadata, such as the templating, annotations and tags.
{
  "id": null,
  "uid": "cLV5GDCkz",
  "title": "New dashboard",
  "tags": [],
  "timezone": "browser",
  "editable": true,
  "graphTooltip": 1,
  "panels": [],
  "time": {
    "from": "now-6h",
    "to": "now"
  },
  "timepicker": {
    "refresh_intervals": []
  },
  "templating": {
    "list": []
  },
  "annotations": {
    "list": []
  },
  "refresh": "5s",
  "schemaVersion": 17,
  "version": 0,
  "links": []
}
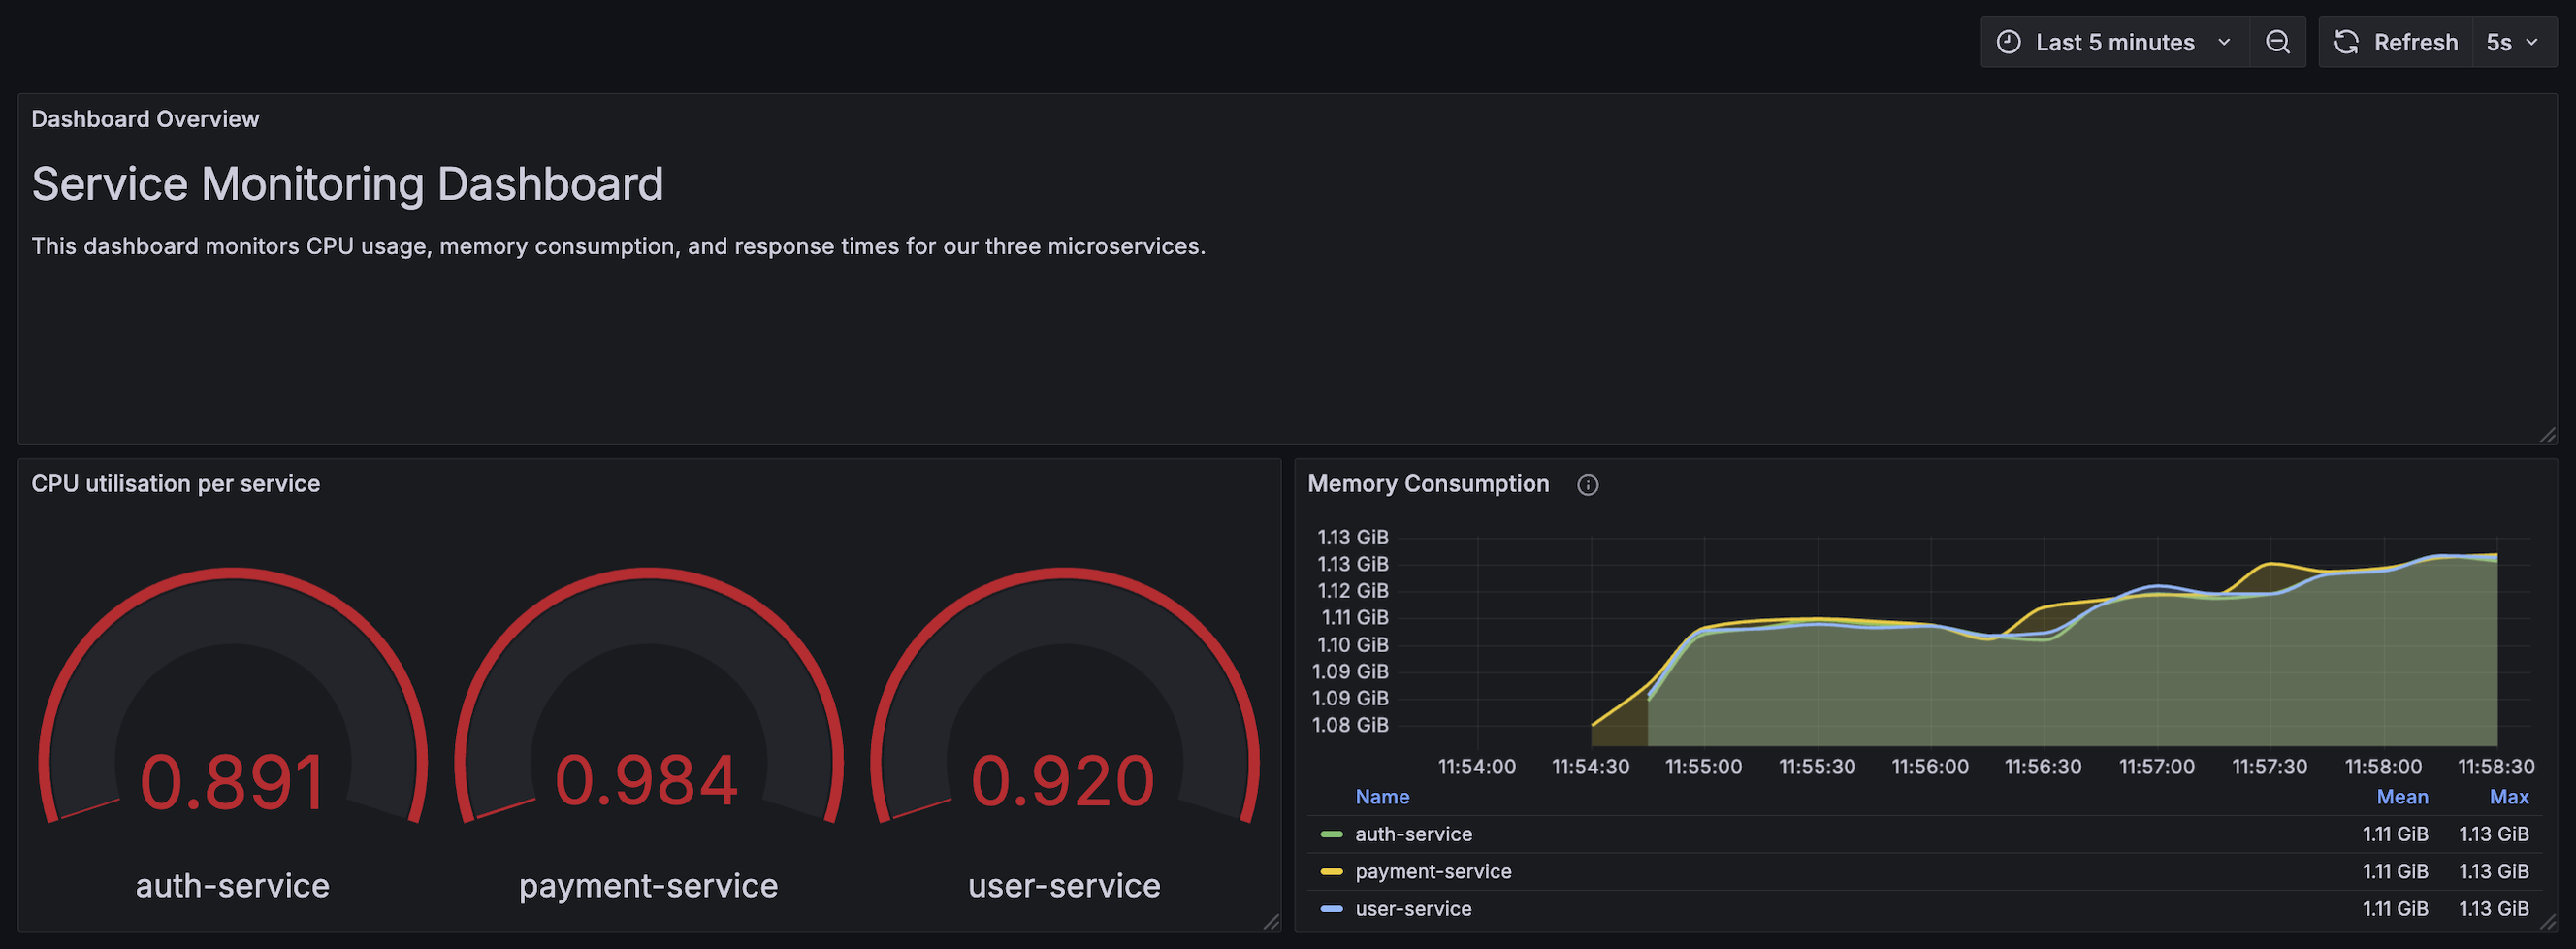
The dashboard shown above has three (3) panels of different types - Text, Gauge and Time Series. This is how they look in the JSON model:
This structure makes it possible to provide all the relevant dashboard to an LLM. We don’t need to load the entire JSON into prompts - we can pick and choose the relevant fields based on the goal. For basic questions, the most common information needed would be the Dashboard ID, title and panel information.
More advanced troubleshooting would then need to provide other fields like options (Panel Options) and fieldConfig (e.g. Thresholds, Overrides).
A full description of the JSON model can be found on the Grafana website.
Prompting
Context is an important part of getting the right help from an LLM. The main source of context is the prompt. Your success depends on how well you structure the prompt and the information you provide 3. You can structure your prompt using three different roles: system, user, and assistant.
The system role sets the overall behaviour/rules for the LLM, while the user role represents the input from the user. The assistant role represents the LLM response. The set of roles for a Grafana assistant LLM would look like the example below:
[
  {
    "role": "system",
    "content": "You are a Grafana expert assistant. You help users with dashboards, queries, data source configuration, panel customization, and alerting. Always provide clear, step-by-step guidance with examples."
  },
  {
    "role": "user",
    "content": "How do I create a panel that shows CPU usage over time using Prometheus in Grafana?"
  },
  {
    "role": "assistant",
    "content": "To create a panel showing CPU usage over time in Grafana using Prometheus:\n\n1. **Add a Panel**:\n   - Click 'Add Panel'..."
  }
]
Getting your prompts right is important. I like to be as descriptive as possible and leave nothing to interpretation. But there’s only so much you can achieve by just describing your dashboard. You’d ideally want the LLM to understand the dashboard natively by providing the relevant dashboard properties for your prompt. This is a form of Retrieval Augmented Generation (RAG).
Retrieval Augmented Generation (RAG)
RAG provides a way to get better context into LLM by first retrieving relevant data to enhance the prompt. Most RAG implementations in the wild use a vector database. When the user query comes in, the vector embeddings are used to do a similarity match to find the most relevant data.
For example, with a vector database based on thousands of incident report documents, an LLM can answer broad questions about incidents during inference. The logic can first do a vector search to find the most relevant incidents based on the user’s query and augment the prompt. I described this in more detail in my previous post (See: Prompt augmentation and response generation).
For Grafana dashboards, we can augment the prompts with dashboard information using the JSON model. We don’t need a vector database, but I still consider this a form of RAG. Before passing a user query to the LLM, we can fetch the dashboard properties and add them to the prompt:
    dashboard = await get_dashboard_via_grafana(dashboard_uid)
    dashboard_info = f"""
Dashboard Title: {dashboard.get('title', 'Unknown')}
Description: {dashboard.get('description', 'No description')}
Dashboard ID: {dashboard_id}
Dashboard UID: {dashboard_uid}

Panels in this dashboard:
"""
    for panel in dashboard.get('panels', []):
        panel_info = f"""
- Panel: {panel.get('title', 'Untitled')}
Type: {panel.get('type', 'Unknown')}
Description: {panel.get('description', 'No description')}
Query: {panel.get('targets', [{}])[0].get('expr', 'No query')}
"""
        dashboard_info += panel_info

    # Create the prompt with dashboard context and modification capabilities
    prompt = f"""

You are a Grafana dashboard assistant with the ability to modify dashboards. You have access to information about the entire dashboard:

{dashboard_info}

You can suggest and make changes to the dashboard based on the user's request. When modifying the dashboard, consider:
1. Panel layouts and organization
2. Panel titles and descriptions
3. Dashboard variables and templates
4. Panel queries and visualizations

User Question: {text}

Please provide a helpful response based on the dashboard context above. If changes are needed, explain what changes you have made and why."""

    payload = {
        "model": MODEL_NAME,
        "messages": [
            {
                "role": "system",
                "content": "You are a helpful Grafana dashboard assistant that can analyze and modify dashboard configurations."
            },
            {
                "role": "user",
                "content": prompt
            }
        ]
    }
This basic form of RAG is a useful way to get more context-aware responses from LLMs about dashboards.
The Model Context Protocol (MCP)
The main limitation of a RAG-only approach is the lack of an intuitive way to take some action based on the LLM response. While it’s not impossible to do so, you’d need to carefully prompt the LLM to return specific data structures. For example, if I need an LLM to modify a dashboard, I’d add prompt to return the relevant updated JSON. I can then parse that JSON in the response and call the Grafana API to make the changes.
While this approach sounds plausible in theory, it’s common to have errors. Some LLMs find it difficult to strictly adhere to the return structure, and it’s easy to exhaust context windows if the LLM is returning entire dashboard JSON models. MCP is a natural solution for this problem 4. With access to a Grafana MCP server, the LLMs can use available “tools” to query and make updates to dashboards.
Grafana has an open-source MCP server in active development at grafana/mcp-grafana. Building the server locally is pretty straightforward. You can then add it to your MCP client (which could be your backend server or even an IDE like Cursor).
# Build the server
GOBIN="$HOME/go/bin" go install github.com/grafana/mcp-grafana/cmd/mcp-grafana@latest

# Add the server config to your client
{
  "mcpServers": {
    "grafana": {
      "command": "mcp-grafana",
      "args": [],
      "env": {
        "GRAFANA_URL": "http://localhost:3000",
        "GRAFANA_API_KEY": "<your service account token>"
      }
    }
  }
}
With the server available, here’s how using MCP works in practice. When a user query is received, the client (your backend) first needs to initialise the server connection. This initial connection provides information about the “tools” available from the MCP server. Grafana MCP has a wide array of tools such as search_dashboards, get_datasource_by_uid, and update_dashboard.
Once the LLM knows what tools are available, it will intuitively call them during inference. The backend can then handle that by checking for any tool calls in the LLM response. The example below will loop as long as there are tool calls, but in practice it’s best to add some validation/guardrails for these calls.
# Connect to the MCP server
session = await _stack.enter_async_context(ClientSession(stdio, write))
init_response = await session.initialize()
print(f"\nConnected to server with protocol version: {init_response.protocolVersion}")

# Get available tools
tools_response = await session.list_tools()
available_tools = tools_response.tools

# Process a query
messages.append({"role": "user", "content": query})

## Convert tools to OpenAI format
tools_for_openai = [convert_tool_format(tool) for tool in available_tools]

## Get initial LLM response
response = openai.chat.completions.create(
    model=model,
    tools=tools_for_openai,
    messages=messages
)
messages.append(response.choices[0].message.model_dump())
final_text = []
content = response.choices[0].message

## If the LLM is attempting a tool call, do it. Or else, return the message
if content.tool_calls is None:
    final_text.append(content.content)
    return "\n".join(final_text)

while content.tool_calls is not None:
    tool_call = content.tool_calls[0]
    result = await self.process_tool_call(tool_call)
    # ...
With an MCP server, we don’t need to load the prompt with dashboard info anymore. The LLM knows to use the search_dashboards or get_dashboard_by_uid tools to get the relevant details.
Handling Context Windows
A context window is the amount of text (or tokens) a language model can “see” and use to understand and generate responses. It is essentially the working memory of the model. A normal window includes your question, the model’s response and any other relevant data. Most LLM providers have limits - GPT-4-turbo allows 128,000 tokens (300 pages of text), while Claude 3 Sonnet allows 200,000 tokens.
As you’ve probaly noticed, the Grafana JSON model can become quite verbose. It’s quite simple to exhaust context limits by having the LLM parse the entire JSON. This is especially a concern while using MCP, as the LLM is at liberty to inspect all the information it deems necessary. I briefly discussed possible strategies in mcp-grafana/issues/101, but this section will explore in more detail.
From my research, there are a couple of options here:
- Vector Retrieval: In the spirit of RAG, we could split each dashboard JSON into chunks, and embed those chunks in a Vector database. During inference, we can then do a similarity search for the most relevant parts of the JSON. While this might work in theory, I’m not sure how much better it is for JSON vs. regular text.
- JSONPath: This was mentioned in the Github issue, and looks promising. It looks like a simple way to query JSON. A simple filter in the MCP server can trim the JSON to the relevant parts and include only those in the response. The known dashboard identifiers (UIDs, titles, data source names, etc), can be used to narrow the search. The tricky part is identifying what fields are being referred to in the query, but I’d imagine that LLMs are great at identifying what the fields are, so lean on them for the translation?
- Structured Chunking: Instead of treating JSON as one monolithic blob, the idea here is to split into logical chunks that are self-contained and meaningful. It’s pretty much a sharding approach but is probably not worth the reasoning complexity.
- Tool-Assisted JSON Access: Not too dissimilar from JSONPath techniques, the idea here is to provide tools to fetch specific parts of the dashboard on-demand e.g. get_dashboard_property. The agent can then use this at will, based on instruction.
This section is probably worthy of a dedicated post with relevant code samples.
Context Pipelines, Guardrails
For most of your prompts to make total sense beyond what is available on dashboards, you’ll probably need to get more widespread context from internal sources. This is not dissimilar to the news context pipeline I described in the last post.
It might however be possible to get that context using what is available to Grafana. If you have great observability practices (i.e. your metrics, annotations and alerts provide a great view of how your systems are running), then you could get away with providing only your telemetry to Grafana. As long as your prompts are direct enough to focus on just the monitoring problems, it should work fairly well.
Guardrails are another hot but useful topic. A common concern with using LLMs is the need for a human-in-the-loop to ensure accuracy. The Grafana team is also thinking about this, and are exploring different ways to improve agent accuracy. The guardrail model (similar to LLM-as-a-judge) is my current favorite way of thinking about this – have multiple agents verify the outputs of the LLMs in different stages. e.g. initial output -> correctness agent -> grammar agent -> Query Verifier agent, etc.
Grafana Cloud LLM announcement, and the future
As I mentioned earlier, users of Grafana Cloud can expect a native LLM integration soon. The interface looks like Cursor a bit, which translates well for existing Cursor users. If you’re however thinking of implementing your own solution, I describe everything in full in my upcoming course on Linkedin Learning!
Amongst other intermediate to advance Grafana concepts, this specific course chapter covers a full intro to LLMs, how it’s relevant to Grafana, the role of RAG/MCP and finally a detailed description and demos of the LLM plugin. If you only want an overview of the idea, feel free to just watch the Youtube video.
To get notified when the course becomes available, feel free to follow me on LinkedIn or Twitter. You can also subscribe to my Substack account below. If you want me to personally reach out to you, try sending a message wherever you can reach me and I’ll do my best to get to everyone.
Finally, the best way to keep track of Grafana advancements is to receive the newsletters from Grafana Labs, which is something you get when you create a Grafana Cloud account. If I hadn’t, I probably wouldn’t have found out that Grafana had publicly announced with LLM plans before writing this.
Footnotes
-
The Past, Present, and Future of BI by Chris Zeoli ↩
-
Query By Example - Wikipedia ↩
-
Introducing the Model Context Protocol - Anthropic ↩
To help me grow on Youtube and learn about Monitoring, Machine Learning, and SRE, please subscribe here.
And to get notifiied about new posts, please subscribe here.