Observing Node.js processes with eBPF
July 2023 • 9 min read
I have a long-running interest in finding ways to observe Node JS applications for faster troubleshooting and reduced Mean-Time-To-Resolve (MTTR) incidents 1. Most Node applications run on Linux and being an SRE, I believe in the ability to troubleshoot applications from the shell without hindering performance.
However, from a Linux kernel perspective, the previous techniques I’ve explored are after-the-fact. You need to obtain information and triage to figure out a root cause. We need a way to correlate Node application events with kernel events without impeding performance. I have been exploring eBPF, and how it is capable of giving us this superpower. I like to think of it as Compound V 2.
Unfortunately, there have been several roadblocks - each resembling a dead end. This article will explore what is possible at the time of this writing, what the roadblocks are, and how you can help if you are so inclined.
eBPF - The Compound V of Kernel Observability
](/media/what-is-ebpf.png)
In the context of this post, eBPF provides a way to observe the kernel by writing custom programs that can be triggered when pre-defined events occur 3. It also has other use cases such as security, and networking. To learn more, you can read this article - “What is eBPF?”.
There are various ways to write eBPF programs, but we’ll primarily be looking at BCC and bpftrace. BCC is going out-of-date because of a new development called libbpf, but that’s beyond the scope of this article 4.
With eBPF programs, users can observe NodeJS at the kernel level using tracing. This is powerful for Sysadmins, DevOps engineers, SREs, etc because troubleshooting is made faster. It can take days to figure out issues that require this level of visibility with current troubleshooting techniques. This is especially because they don’t happen often.
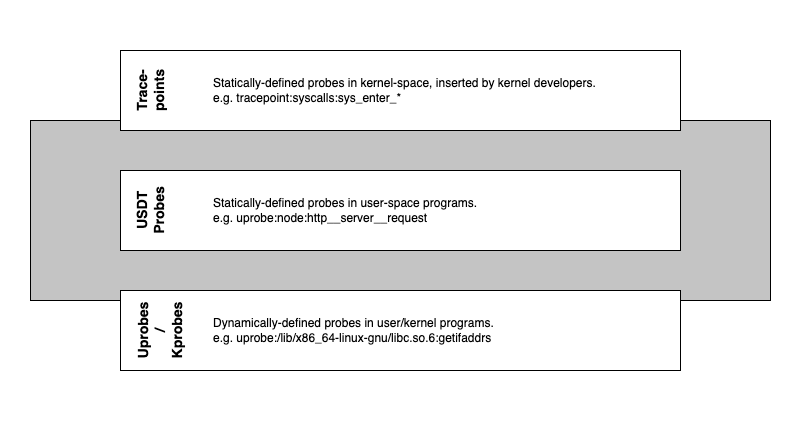
There are two types of tracing available - static (tracepoints, USDT probes) and dynamic (kprobes, uprobes).
What are the possibilities?
If this works, you should be able to generate a NodeJS stack trace from observed behavior on a Linux machine. e.g. is the program writing to files excessively? Is there a certain network path that shouldn’t be happening?
It is worth pointing out again that there are other ways to get this information, e.g. instrumentation, core dumps debugging, etc. This is for those who can’t modify the application, but also can’t hinder performance. It’s also useful for maintainers who want to do this without deploying code changes.
Since it’s hypothetical, we can draw up some scenarios:
- The Node process is making a HTTP request that is unaccounted for. Has one of the package dependencies been compromised?
- After a new deployment, the process suddenly dies midway through the critical path. You roll back and spin up a test environment to replicate the issue. What next?
With a BCC program, you could print out the stack trace from a dynamic or static probe.
In (1) we can trace the call made for every HTTP request, filter to the anomalous URL, and print the stack trace. In (2), we can do the same but for the disk syscall. It is worth pointing out though, that for syscalls that are called frequently, tracing can add significant overhead. It is important to benchmark performance before the widespread use of your program.
With this type of tracing there is no need to collect a core dump, or slow down the Node process with perf, etc. Unfortunately, it’s not this easy in reality.
A very unhappy union
At the time of this writing Node and eBPF are not compatible for various reasons, but primarily support. Node had support for USDT Probes but they were removed recently in nodejs/node#43652. The reasons for removal include a lack of maintainers and low demand from the community.
“But why does Node need to support eBPF? Why doesn’t it work out of the box?”
The short answer is that Javascript is a JIT-compiled language. These are difficult to trace from the kernel because they store function→memory address mappings in memory and don’t have symbol tables out-of-the-box. For complete stack traces, the kernel (and BPF) needs to find the memory address of a function and vice versa 5. Therefore, Node can support by adding USDT probes for important functions. More on that in the last section.
There was a discussion about bringing support back in nodejs/node#44550 but it got closed because of bandwidth. As long as the number of active maintainers + demand remains low, the chances that it’ll remain removed are high.
While I really believe we should bring it back, I don’t have the bandwidth to work on this for the next months. Therefore, I’ll close it. If someone wants to take the lead on that, please see my previous comment and feel free to ping me for guidance. - RafaelGSS
If this is something you’re interested in seeing exist - and you want to contribute to an impactful open-source project, here’s your chance. You can join the discussion (and volunteer) here.
If you just want it to exist, you should still comment on the thread with your use case, which will help the case of demand 6.
Great things happen to those who don’t stop believing
I hope that we get proper support in the future, but that doesn’t mean it’s totally impossible right now - it’s just a PITA. This section introduces tracing methods in eBPF and if they can be fit for this purpose. Let’s evaluate the different types of eBPF instrumentation available, against NodeJS:
Tracepoints (Static)
Tracepoints are used for kernel-level static instrumentation. They help trace calls that kernel developers have inserted into the code and compiled into the kernel binary. Hence we can use them to trace kernel syscalls such as open(2), write(2), etc.
I speak of tracepoints for knowledge’s sake, because for the reasons discussed in “A very unhappy union” above, it’s very unlikely that you can get Node stack traces by instrumenting syscalls directly. You can learn more about trace points in general by reading the book “BPF Performance Tools”.
USDT Probes (Static)
USDT probes are a way to instrument user-space functions with a static definition. USDT stands for User Statically Defined Tracing. They are like tracepoints but instead created by user-space developers for their code. e.g. Node. However, as mentioned above, NodeJS had a bunch of built-in probes but has removed them, so this method cannot be used directly.
For a good overview of what was possible with the USDT probes, you can take a look at Linux bcc/BPF Node.js USDT Tracing. The presence of these probes certainly makes it easier to get started, as different “breakpoints” exist for tracing. e.g. with the u:node:http__server__request probe, it was possible to trace every HTTP request, custom args, and stack trace:
# start the Node process
vagrant@bullseye:/vagrant$ /usr/bin/node src/app.js
go to http://localhost:8080/ to generate traffic

# on another shell
vagrant@bullseye:~$ sudo python3 /vagrant/bcc/node_function.py `pgrep node`
3 warnings were generated.
TIME(s)            COMM             PID    ARGS
2107.831368000     <...>            67641  path:/
2253.196817000     node             67641  path:/wget
2259.551289000     node             67641  path:/
2284.295907000     node             67641  path:/
2289.744545000     node             67641  path:/wget
2293.650562000     node             67641  path:/wget
UProbes (Dynamic)
Uprobes are a way to dynamically instrument user-space functions. They can be useful for debugging and understanding application behavior using custom probes. A uprobe can be added to a running Node process once the target function is known, which makes it the ideal way to get us our superpower.
With this knowledge, we can add a uprobe to a running Node process once we know the target function. It’s not that simple though, because the target function cannot be a regular function you crafted in your IDE. We need to use functions that can be observed on the kernel and for that, libuv comes to our aid.
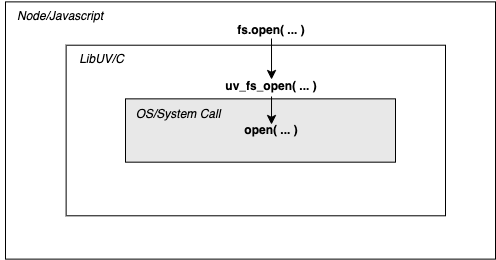
The TLDR about libuv is that it is used by Node to handle Async I/O operations. It calls the kernel on behalf of Node for functionality like File System operations and DNS - hence its functions are traceable using attached uprobes from BCC or bpftrace 7.
A non-trivial solution is better than no solution
We know where to trace from now (libuv functions), and what tools to use (uprobes, bpftrace, bcc). How does this hold up in practice? The following steps describe a workable solution:
-
List the
libuvfunctions in the Node binary. This is how you know what you can add a uprobe to. It’s quite verbose so you can filter out unneeded functions usingegrep. e.g to list the fs functions:vagrant@bullseye:~$ objdump -tT /usr/bin/node | grep uv_fs | egrep -v "(4node|ZN6)" | head -n10 0000000001138910 l F .text 0000000000000466 uv_fs_event_start.part.0 00000000011295f0 g F .text 0000000000000110 uv_fs_chmod 000000000111e6a0 g F .text 000000000000018e uv_fs_poll_start 000000000112a9a0 g F .text 00000000000000c5 uv_fs_readdir 0000000001139a80 g F .text 00000000000000bd uv_fs_event_stop 000000000112ad00 g F .text 000000000000013e uv_fs_rename 0000000001129ce0 g F .text 00000000000000a7 uv_fs_fsync 0000000001123f20 g F .text 000000000000006e uv_fs_event_getpath 000000000112b800 g F .text 0000000000000007 uv_fs_get_system_error 000000000111e8f0 g F .text 00000000000000ae uv_fs_poll_getpath -
Read the docs to see what the function arguments are. You will need this when trying to print arguments like what path was called. To find a function, you can search the
libuvdocs. e.g. this search for uv_fs_rename shows that the 3rd argument is the file path, the second is a req struct, etc. If you’re curious, you can search for the unfamiliar struct names using the same technique as well. Overall, the file path seems the most useful for these FS calls... c:function:: int uv_fs_rename(uv_loop_t* loop, uv_fs_t* req, const char* path, const char* new_path, uv_fs_cb cb) Equivalent to :man:`rename(2)`. -
Attach a uprobe using bpftrace to the
libuvfunction, and you can trace any calls from Node to that function. The syntax for a uprobe isu:/path/to/binary:<function-name>. The example below prints out the Process name, PID, File Path and Stack Trace when theuv_fs_openfunction is called 8. The file path is the string value ofarg2as the path is the 3rd argument. For more information about args, see this section of the bpftrace reference guide.# Run Node with debug symbols and a mock endpoint that opens a file vagrant@bullseye:~$ /usr/bin/node --perf_basic_prof_only_functions /vagrant/src/app.js go to http://localhost:8080/ to generate traffic gotten file gotten file # Generate test traffic vagrant@bullseye:~$ while true; do curl localhost:8080; sleep 2; done [...] # Attach a uprobe to uv_fs_open vagrant@bullseye:/vagrant$ sudo bpftrace -e 'u:/usr/bin/node:uv_fs_open { printf("process: %s, pid: %d, file path: %s, stack: %s\n", comm, pid, str(arg2), ustack) }' process: node, pid: 349854, file path: /vagrant/src/text.txt, stack: uv_fs_open+0 [...] uv__read+629 uv__stream_io+160 uv__io_poll+1372 uv_run+324 node::NodeMainInstance::Run()+620 node::Start(int, char**)+492 __libc_start_main+234 0x5541d68949564100 process: node, pid: 349854, file path: /vagrant/src/text.txt, stack: uv_fs_open+0 Builtin:CallApiCallback+173 LazyCompile:* /vagrant/src/handler.js:6+3045 Builtin:ArgumentsAdaptorTrampoline+188 Builtin:PromiseFulfillReactionJob+50 Builtin:RunMicrotasks+538 Builtin:JSRunMicrotasksEntry+120 v8::internal::(anonymous namespace)::Invoke(v8::internal::Isolate*, v8::internal::(anonymous namespace)::InvokeParams const&)+956 [...] node::LibuvStreamWrap::OnUvRead(long, uv_buf_t const*)+123 uv__read+629 uv__stream_io+160 uv__io_poll+1372 uv_run+324 node::NodeMainInstance::Run()+620 node::Start(int, char**)+492 __libc_start_main+234 0x5541d68949564100 vagrant@bullseye:/vagrant$
The output is pretty verbose so I cut out the internal Node functions. In an ideal world, we’d see the full Node stack traces all the time, but as mentioned above this is inconsistent because of the JIT nature of Node. I see some express functions once in a while, but not often enough to be useful.
Regardless, this is powerful because you can filter out by the process, thread, cgroup (for containerized environments), etc. You gain the ability to correlate what is happening on a machine with a Node process, without touching any code.
For HTTP requests, however, I did some digging and I’m not convinced that Node uses libuv entirely for them. There are some TCP, DNS functions, but it’s hard to draw a straight line from the Node HTTP module to them. Someone with a better understanding of NodeJS internals would be better placed to investigate that.
This technique can theoretically be used on any underlying library used by Node that satisfies these parameters.
It’s been a long journey
I skipped a bunch of things in the final solution to make it as straightforward as possible. Some notes in that regard, below:
- If you are interested in learning more about some other paths I explored, how I built Node with DTrace for the USDT probes (and some rants), I put a brain dump here.
- If you want to try this and are running on a Mac, I recommend setting up Vagrant. See the “Using Vagrant” section of this post.
- The solution uses bpftrace, but you can also write a bcc program to attach the uprobe. A good example of a similar program can be found in the nodejs_http_server bcc example.
Overall, I think this is too difficult and isn’t a long-term solution. Please don’t forget to comment/react on the Node issue that discusses support for eBPF, so you don’t have to do it, even if it’s fun to figure out :).
Footnotes
-
Previous articles examine CPU, Memory profiling, etc. I haven’t written about disk profiling yet. ↩
-
Compound V is a chemical in the hit TV series - The Boys. It grants superpowers to the heroes (if you choose to call them that). ↩
-
With eBPF, users can “run sandboxed programs in a privileged context such as the operating system kernel”. It can be used to extend the features of the kernel without making code changes. ↩
-
You can learn more about libbpf and how it makes life easier than BCC in “Why We Switched from BCC to libbpf for Linux BPF Performance Analysis”. ↩
-
Along with the lack of symbol tables, they can also move function addresses around without informing the kernel. This means that user-generated symbol tables could even get stale too. See Section 12.3 “Java” of BPF Performance Tools to learn more about tracing JIT-compiled languages. Some progress has been made with Java. ↩
-
I am learning that in open-source if you don’t speak up, it’s very likely that your desired features get dropped (especially when they performance-related). That’s why people like Brendan Gregg are so far ahead - others don’t care about these things until they have production problems. ↩
-
More information about how to understand the correlation between
libuvfunctions and Node internal functions in Exposing Node.js internals. ↩ -
This bpftrace cheatsheet by Brendan Gregg is useful for checking what is available to expose, from bpftrace. ↩
To help me grow on Youtube and learn about Monitoring, Machine Learning, and SRE, please subscribe here.
And to get notifiied about new posts, please subscribe here.